Here are some game notes for the Opening Day STL/PIT game from yesterday. Continue reading
Opening Day Starters
Opening day is almost here. Every team but the Yankees has named their opening day starter, so here’s a team-by-team look at those selections, with some (hopefully) interesting related tidbits.
More after the jump.
WAR and WAR/162 rankings over 2013-2015
I just ran some numbers to see what they show. I took the 191 players to play at least 324 games (2 seasons’ worth) over the last 3 years and ranked them by their WAR total (ugh, Skip Schumaker!). Then I calculated their WAR per 162 games played. Finally, I sorted the results by ranking difference between their raw WAR total and WAR/162 value. Players at the top of this list jumped up the most places–so mainly these are guys who didn’t quite play 3 full seasons but posted high WAR totals. Players at the bottom of this list fell the most places, and they are mainly guys who played a lot and accumulated decent-but-not-great WAR totals that suffered when normalized to games played.
The full table is after the jump. Continue reading
Thinking about offense in April
I’m working on a USA Today Sports Weekly piece, and there sure is a lot of interesting stuff that happens in April.
We know that relievers have tossed an increasingly large fraction of innings over the years. In the 1970s, relievers tossed about 20% of all innings. In recent years, the percentage has been closer to 24%. That may not seem like a lot, but with a little over 43,000 innings last year, that extra 4% represents more than 5000 outs being recorded by relievers instead of starters.
It’s interesting to break down relief pitching even a little further, looking at what happens in all MLB games through the end of April vs the remainder of the regular season after April. Here is the percentage of innings pitched by relievers in those two conditions:
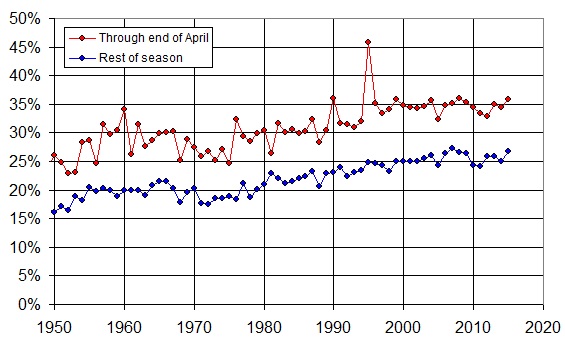
Both lines trending up over the years indicate what we already knew: relievers are throwing more and more innings, and it’s true for both April and the rest of the months. Incidentally, that spike for April in 1995 is due to the delayed start of the season from the 1995 strike–both a small sample size of games, and pitchers who had very little spring training to get ready.
Relievers have tended to be more effective than starters, especially as bullpen specialization (9th-inning closer, 8th-inning setup guy, and LOOGY) has increased. Because relievers roles are better defined, they can warm up more efficiently and not worry about leaving anything in the tank. This leads to harder pitches, more strikeouts, and less offense.
Take a look at the ratio of the two lines in the plot above. This quantifies how much more pitching relievers do in April vs the rest of the season. For example, in a given year, if they threw 30% of April innings and 20% for the rest of the season, that would register as 150% for that year, since they threw 1.5 times as many of the April innings (on a percentage basis).
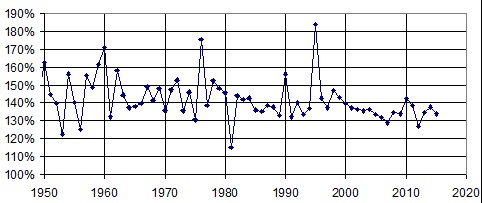
Throughout the 1970s, relievers pitched about 1.45 times as many innings than they did during the rest of the season (again, on a percentage basis). In the 1980s, it was about 1.40. In the 1990s, when offense spiked, so did the relievers’ innings (as starters were getting knocked out like crazy) but over the 2000s the value dipped as low as 1.30, a value it has hovered around in recent innings.
This makes sense for a couple of very different reasons:
- First of all, there are only so many innings. It’s hard to imagine starters averaging less than 6 IP per start, league-wide. So whereas they once averaged 8 IP per start, that slid down to 7, then down to 6.5, and now is approaching 6. But it just can’t fall much lower. So, we’ll likely never reach the point where relievers are tossing 40% or more of innings over any significant period of time.
- Secondly, imagine the patterns of relief pitching over the years. When complete games were still common (think 1950s through 1970s on these graphs), pitchers at the start of the season were a little less likely to toss a complete game because they weren’t yet stretched out. Therefore, in years gone by, relievers were more likely to appear in April than later in the season. hence the larger percentage difference during those eras. Once we got into the 1980s, complete games started to become less common overall, and relievers started appearing more consistently during the season, April and otherwise alike. Now that the complete game is for all intents and purposes the dodo, relievers appear all the time, season-long, and the difference between April and the rest of the season is diminished.
Do you realize what this means? It means the notion that “pitchers are ahead of hitters early in the season” is wrong. The more likely explanation is that “relievers were used more frequently in April in years gone by, and were more effective, hence lower April offense, but now that there is much less difference in relief pitcher usage, there is little difference in April offense and that of the other months.”
Leadoff hitters: getting off on the wrong foot
Last season marked the 6th consecutive campaign with OBP below .330 for major league leadoff hitters. If it happens again in 2016, it will mark the first time since at least 1913 that that’s happened in 7 consecutive seasons. 2015 also marked the fourth straight season with at least 10% of major league teams posting a sub-.300 OBP from the number one hole; it’s the first time that’s happened in more than 40 years.
The good news (I guess) is that poor leadoff hitting didn’t stop the Kansas City Royals from becoming only the sixth team since 1913 to win the World Series with leadoff hitters posting a sub-.300 OBP. More on trends in leadoff hitting after the jump.
Today is the craziest possible day for MLB names
St. Patrick’s Day is always interesting for names. Lots of babies born on this day end up being given the first or middle name of Patrick. Among the 41 MLB players born today, eight (Pat Seery, Pete Reiser, Dan Masteller, John Smiley, Larry Murphy, Pat Gomez, Rick Lisi, & Bill Gannon) have the first or middle given name of Patrick.
But that’s just the tip of the iceberg for unusual names among MLB players with a birthday today. Click through for the really unusual stuff. Continue reading
What’s new at High Heat Stats
Andy here with just a few quick updates.
- I’m updating the theme–it may look a bit wonky for a couple of days, but I’ll get it all sorted out.
- Importantly, it will continue to run fast and lean.
- We are about to embark on another season of writing for USA Today Sports Weekly. I have a great group of writers, including a bunch of new folks. Ely will also be posting all the articles here on HHS, so you can just keep watching here to see them all.
- We’ll also have new content coming to this site here, from both new authors and old.
UPDATE: congratulations to Doug, who has been promoted to HHS’ new Senior Baseball Writer. Many thanks to him for keeping the site alive for quite a while now.
Quiz – Division Champion Relievers (stumped)
All of these pitchers played for a division champion. But, they also did something else to distinguish themselves from all other relief pitchers since divisional play began in 1969. What is this unusual pitching accomplishment?
The pitchers are:
- Wade Davis,
- Santiago Casilla,
- Zach Britton,
- Koji Uehara,
- Joaquin Benoit,
- Rafael Betancourt,
- Cla Meredith,
- Michael Jackson,
- Dennis Eckersley, and
- Dick Hall.
Click MORE for links to these players’ Baseball-Reference pages.
The solution to the quiz is that these are the only relief pitchers on a division-winning team to face fewer than 3.75 batters per IP in a 50 IP season with zero starts. More on efficient relief seasons after the jump.
Free Agency by the numbers
But, not the numbers (with lots of zeros after them) that you’re probably thinking about. Baseball’s annual rite of fall and winter has just about run its course. As of this writing, Baseball-Reference is recording 414 free agent signings since the end of last season, with only 8 more players still on the market.
How did your team do in the free agent sweepstakes? Find out after the jump.
Quiz – Double Trouble (solved)
The 2012 Minnesota Twins have the unfortunate distinction of being the only club in more than 35 years with some unusual position players on its roster. What unenviable characteristic distinguishes these clubs from among all other post-war teams?
Rk | Year | Tm |
---|---|---|
1 | 2012 | Minnesota Twins |
2 | 1979 | Cleveland Indians |
3 | 1976 | California Angels |
4 | 1976 | San Diego Padres |
5 | 1976 | Texas Rangers |
6 | 1972 | Montreal Expos |
7 | 1968 | San Francisco Giants |
8 | 1959 | Philadelphia Phillies |
Hint #1: There were twelve such teams from 1920 to 1941, and seven more from 1942 to 1945. Seventeen of those 19 teams were Braves, Phillies, Athletics and Reds clubs.
Hint #2: The recent passing of 1960s Giant third baseman Jim Davenport led me to this topic (though he wasn’t one of the players that put the 1968 Giants on this list).
Congratulations to bstar! He correctly identified that only these post-war teams had two players qualify for the league batting championship with ISO of 0.05 or less. More after the jump.