Here’s something I’ve never understood:
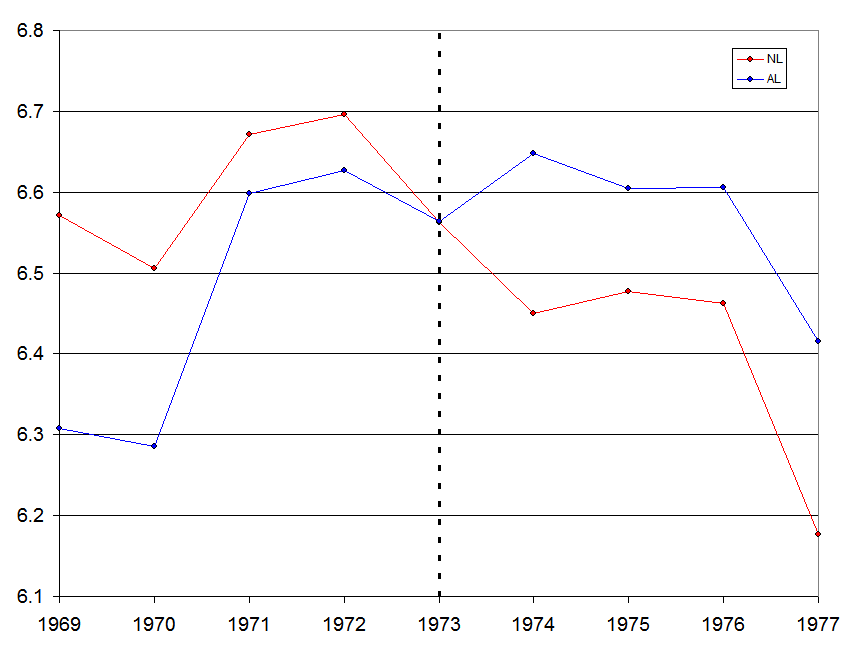
This is the average innings pitched by the starting pitcher, by year, broken down by leagues.
There are at least two things about this plot that make no sense to me. Click through for more.
wpdiscuz domain was triggered too early. This is usually an indicator for some code in the plugin or theme running too early. Translations should be loaded at the init action or later. Please see Debugging in WordPress for more information. (This message was added in version 6.7.0.) in /home/highheatstats/highheatstats.com/wp-includes/functions.php on line 6121
Here’s something I’ve never understood:
This is the average innings pitched by the starting pitcher, by year, broken down by leagues.
There are at least two things about this plot that make no sense to me. Click through for more.
Hi! My name is David Hruska and I’m a Springfield, MO resident who’s new around these parts. I’ve been a baseball fan for as long as I’ve been able to breathe and I’m very excited to be working with the great people at High Heat Stats. When I’m not watching baseball or at work I tend to spend my time with my college sweetheart grilling the most delicious BBQ that you can possibly imagine. You can catch more of my musings, thoughts, and ramblings at thecutoffman.mlblogs.com.
Miami Marlins owner Jeffrey Loria talked a big game just one offseason ago, acquiring big-name free agents like Heath Bell, Jose Reyes, and Mark Buehrle while making a run at the biggest fish in the sea, Albert Pujols. While Loria’s attempts to lure Pujols to South Beach would ultimately prove unsuccessful, the message was sent nonetheless: these new Miami Marlins were finally willing to open the pocketbooks to win. But the wins never materialized and dysfunction quickly set in. The Marlins slummed their way to a dismal 69-93 record which was good for a 2nd consecutive last place finish in the NL East.
The Marlins, as they are notorious for doing, decided that this current roster wouldn’t get the job done. They opted to leverage nearly all their usable roster pieces into future assets, making multiple trades that left the big league roster in tatters. Out the door went Jose Reyes, Josh Johnson, Mark Buehrle, Heath Bell, Hanley Ramirez, Anibal Sanchez, and their combined 13 All-Star appearances, only to be replaced by a handful of minor league prospects plus some veteran placeholders. If the Marlins could only muster 69 wins with that group of players, it was worth wondering how low they could go with an even less talented group. Well, if the early returns are worth anything, these 2013 Miami Marlins may make a run at some truly terrible history.
This post is for voting and discussion in the nineteenth round of balloting for the Circle of Greats. This round begins to add those players born in 1952. Rules and lists are after the jump. Continue reading
George Brett was an overwhelming favorite this round, appearing on a dominating 93.4% of the ballots on his way to induction as the 18th player in the Circle of Greats. That’s the highest percentage we’ve had for anyone yet. No need for a pine tar protest this time, George. More on Brett and the voting after the jump.
Continue reading
John’s taking a well-deserved night off, so here’s a brief (and pale) imitation of the original.
Rockies 1 @ Cubs 9. The Rox offensive woes continued as they managed just one run or less for the fourth time in five games, and 2 runs or less in 6 of their last 7. If not for a Josh Rutledge homer in the 9th, Colorado would have been shut out for the 3rd time in 4 games, something no Rockies team has ever done. That charge from the gate with 6 or more runs in 10 of their first 15 contests (something only 23 other clubs have done) seems but a distant memory.
More after the jump.
Here are the highest OPS numbers posted, since 1916, by a major league team over a full calendar month (min. 750 PAs):
1. Yankees (June, 1930) 1.035 OPS
2. Cardinals (April, 2000) .959 OPS
3. Red Sox (June, 2003) .945 OPS
4. Indians (April, 1997) .942 OPS
5. Indians (July, 1936) .940 OPS
6. Mariners (May, 1999) .935 OPS
7. Giants (June, 2000) .932 OPS
8. Cardinals (July, 1928) .931 OPS
9. Yankees (May, 1936) .929 OPS
10. Yankees (July, 1927) .925 OPS
Cubs 8, @Nationals 2: Stephen Strasburg retired the first 11 Cubs, as if we’re impressed by that any more, and matched zeroes through 4 with Edwin Jackson (which is far more remarkable). With two down and a clean slate in the 5th, Ryan Zimmerman made his daily throwing error …
Here are a group of dominating pitchers, among the elite in the game’s history. They have distinguished themselves from their live-ball era brethren by dint of achieving a certain seasonal feat.
What is this feat achieved by no other pitcher since 1920?
| Rk | Player |
|---|---|
| 1 | Pedro Martinez |
| 2 | Roger Clemens |
| 3 | Greg Maddux |
| 4 | Kevin Brown |
| 5 | Dwight Gooden |
| 6 | Ron Guidry |
| 7 | Tom Seaver |
| 8 | Luis Tiant |
| 9 | Bob Gibson |
| 10 | Sandy Koufax |
| 11 | Lefty Grove |
Hint: some of these pitchers achieved this feat more than once
Congratulations to John Autin! John identified these pitchers as the only hurlers since 1920 with a season of 200+ IP and an ERA+ > 200 x WHIP. Take a look at these spectacular seasons after the jump.
Miller and Lester, fine — but I’ve got an SP line that hadn’t occurred in 90 years, and it’s not Alex Cobb, either. You’ll have to read through to find it.
Here’s a plot showing the percentage of balls in play each year. Specifically, this refers to the fraction of plate appearances that result in a ball being handled by the defense.
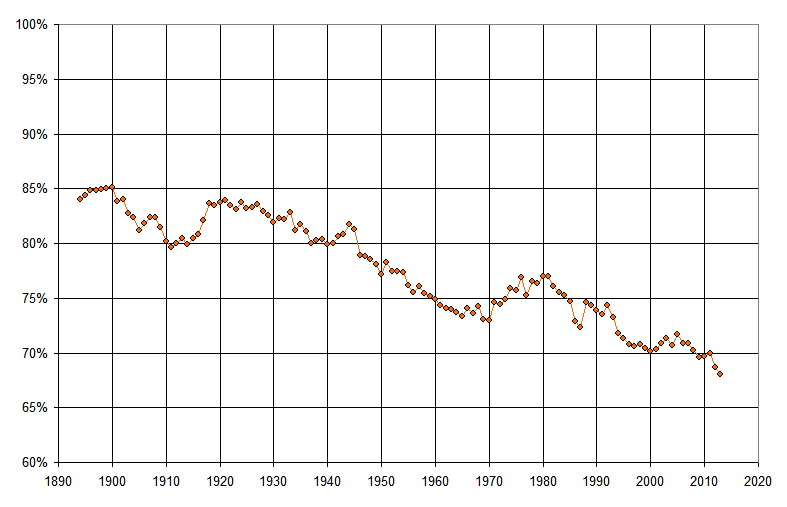
The formula uses at-bats in the numerator, subtracting out home runs and strikeouts, and adding sacrifice hits and sacrifice flies. That total is then divided by plate appearances, which of course includes walks and hit-by-pitch.
As you can see, 2013 is on pace to have the lowest percentage of balls put in play in MLB history. And even though 2013 is far from over and could change, 2012 itself set the all-time record, at just 68.7%.
The two biggest factors are, of course, home runs and strikeouts. Even in this year of very low offense, home runs are still quite high. I wrote about that in my USA Today Sports Weekly piece this week. Strikeouts continue to go higher and higher, and drive the percentage of balls in play lower and lower.
Some comments and implications about the above graph:
The game is changing, for sure…