Author Archives: Doug

Best and Worst Hitters Against Different Pitches

That’s pitches, not pitchers! In the never-ending cat-and-mouse game between pitcher and hitter, the pitcher’s biggest advantage is choosing the type of pitch to throw to different batters in different situations. Fangraphs provides summary data from PitchFX, the system employed by MLB to track every pitch thrown in every game. Included are data on the success of each hitter against different types of pitches. Those data for the 2016 season are after the jump.

Continue reading

MVP Elections – 1997 NL

Dr. Doom here again, with yet another MVP post.

The National League in 1997 was an interesting bird. The second-best team was the Florida Marlins, who won the wild card.  The best team was the Braves – just as they had been in 1996, and 1995, (1994 was the strike year,) and 1993, and 1992, and 1991.  And they would be again in 1998, and in 1999.  The ’90s were their party, alright.  Too bad it didn’t work out for them in the World Series department.  Anyway, one of the oddest things about the 1997 NL is just how balanced it was; only 3 of the 14 teams were more than 5 games under .500.  And of course, this was the middle of Selig-ball.

Incidentally, 1997 was probably the first season that I followed really heavily from start to finish.  I had been following the AL from before the strike, at least a little.  But, in the Brewers final year in the AL, I thought it was about time to start checking out the competition.  And, of course, with 1997 being the advent of inter-league play, it was the perfect time to start learning.  It was also convenient, for the purposes of this post, that I remember bits and pieces of this year.  But, because we’re in the heart of Selig-ball, just remember that the numbers are going to be a LOT bigger all of a sudden, both for position players and pitchers.  May your eyes adjust well! Continue reading

Hitting in the Clutch

In their 2007 work “The Book” (as in “Managing by …”), Tango, Lichtman and Dolphin used hard statistical analysis to debunk any number of notional ideas about baseball players and teams, among them that certain players are “clutch” performers. Their analysis indicated that whatever clutch tendencies players might exhibit in a given season would “correct” over time such that performance levels over a career would be much the same in “clutch” situations as in any other.

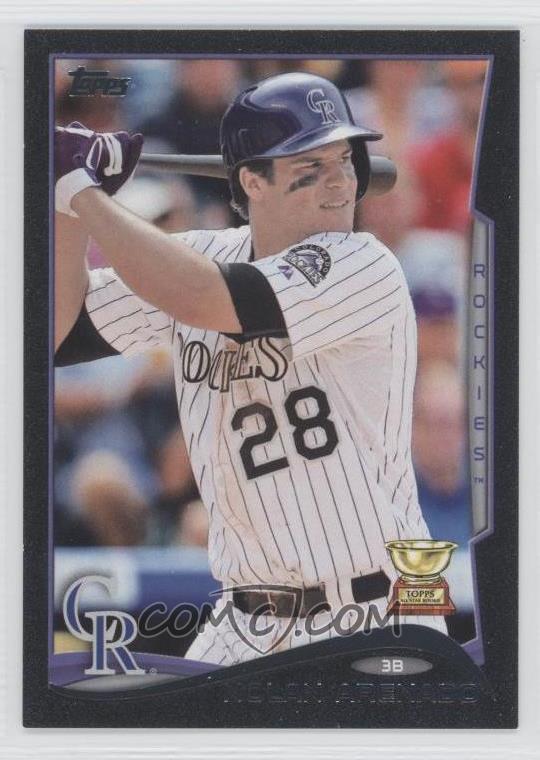
But, that doesn’t stop us from looking at those one-season tendencies, which I’ll explore next in looking at the players (like the Rockies’ Nolan Arenado to the left) who were best in the clutch in the 2016 season. Continue reading

Quiz – Modern Mashers (and one ahead of his time) (stumped!)

This quiz involves eight players, all but one of which were active in the past 30 years. Yet they are only players in majors history to retire with a certain career accomplishment. What is it?

Seems I’ve managed to stump the HHS panel. The quiz answer is that only these players recorded a 3000 PA career having 45% of hits go for extra bases, and with doubles comprising 45% of extra-base hits. More after the jump. Continue reading

MVP Elections – 1986 NL

Hello again, everyone!  Dr. Doom here with another MVP post.

This time, we examine the National League of 1986.  I’ll get to the pennant race (which I normally start with) in a moment, but I want to begin by saying something about the MVP voting of 1986.  This was the year of the aging player.  The vast majority of the players who show up here were stars already in the late-1970s, yet hung around long enough to still be in play in 1986.  And, to their good fortune, when some of them had a resurgence, the NL was weak enough that their good-but-not-great performances were enough to stand out.

The second-place teams in each league won 86 in ’86, which I guess would’ve been fine if the division winners hadn’t won 96 and 108 games.  There was no race to speak of in either division, with the Astros pulling away in late July and the Mets having the division sewn up by May Day, by which point they already had a 5-game lead after having taken over first place for good on April 22nd. The Mets finished the season with 108 wins – matching the ’75 Reds with a number that hadn’t been seen in the NL since the 1909 Pirates!  To this day, only those Pirates and the 1906 Cubs have won more games in the National League than the 1986 Mets. Continue reading

MVP Elections – 1985 AL

Greetings yet again, my HHS friends!  Dr. Doom, via Doug, posting about yet another MVP race.

Remember how I seemed obsessed with the National League in the 1960s?  Well, the American League in the 1980s was undoubtedly even more confusing.  Today’s target is 1985.

1985 featured a rarity – two good division races in one league. Following a three-game sweep on the road to the Tigers, Toronto led the AL East by 3 with three to play… against the 2nd place Yankees.  The Yanks took the first, and a Yankee sweep would win the division.  Of course, Toronto won game #161 to wrap things up, but that’s nearly down to the wire.  In the West, with seven to play, the Royals trailed the Angels by a game, but were ready to face the division leaders in a four-gamer in Kansas City.  The Royals took three out of four to go up two games, entering a weekend homestand against Oakland.  Simply taking two games from the A’s would win the division… which they promptly did, wrapping everything up in game #161.  But hey – both divisions were in play on the penultimate day of the season, so that’s not so bad.

Continue reading

Today’s Young Guns and WAR Contribution by Age

Followers of the game will be aware that baseball today is awash in young talent, including the group below, showing their career totals through their age 22 seasons.

Rk Player Year WAR/pos From To Age G PA R H HR RBI BB SO BA OBP SLG OPS Pos Tm
1 Carlos Correa 2016 10.1 2015 2016 20-21 252 1092 128 266 42 164 115 217 .276 .354 .475 .829 *6/H HOU
2 Francisco Lindor 2016 10.3 2015 2016 21-22 257 1122 149 304 27 129 84 157 .306 .356 .454 .810 *6/HD CLE
3 Bryce Harper 2015 19.8 2012 2015 19-22 510 2143 328 528 97 248 279 449 .289 .384 .517 .902 978/HD WSN
4 Manny Machado 2015 17.7 2012 2015 19-22 451 1979 252 511 68 215 128 330 .281 .330 .458 .787 *5/6 BAL
5 Mike Trout 2014 28.6 2011 2014 19-22 493 2195 373 572 98 307 269 489 .305 .395 .549 .945 *87/D9H LAA
6 Jason Heyward 2012 14.7 2010 2012 20-22 428 1730 226 392 59 196 200 373 .261 .352 .447 .799 *9/H8 ATL
7 Giancarlo Stanton 2012 12.4 2010 2012 20-22 373 1498 199 358 93 232 150 432 .270 .350 .553 .903 *9/HD8 FLA-MIA
Provided by Baseball-Reference.com: View Play Index Tool Used
Generated 1/6/2017.

In fact, the players above all compiled 10 or more WAR by age 22. What may surprise you to learn, though, is that these 7 players from just the current decade represent fully one-sixth of all such everyday players since 1901. But, will they continue to produce handsome WAR dividends for their teams as their careers progress? To answer in a few words, for most of them, it’s very, very likely.

After the jump, more on being very good when very young, and projecting that success over a career.

Continue reading