Author Archives: Andy

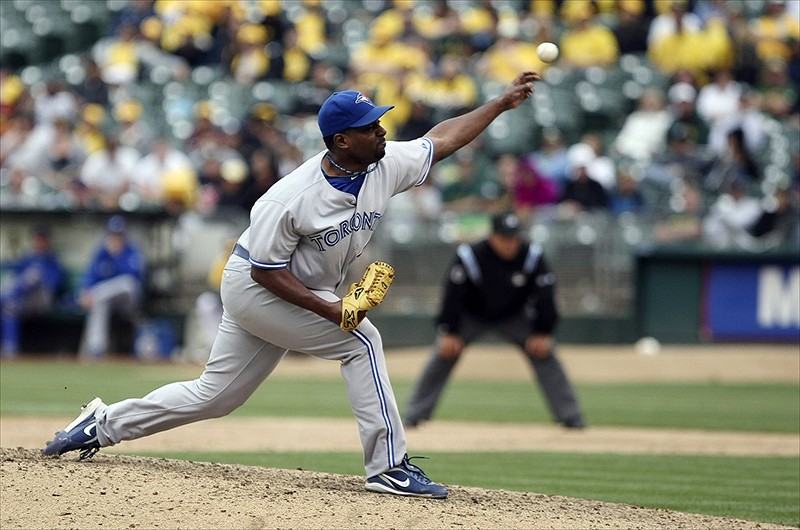
The amazing Darren Oliver @southpawDO28

Darren Oliver / Kelley L Cox-USA TODAY Sports

Darren Oliver / Kelley L Cox-USA TODAY Sports

Darren Oliver has re-signed with the Blue Jays for 2013 and he’ll be coming back for his 20th season in the majors. He’ll be 42 on Opening Day.

Perhaps the most incredible thing about Oliver’s career is that he isn’t simply hanging on into old age. His line for the last 5 years (2008-2012) reads like this: 304 games, 1 start, 314.1 IP, 271 H, 79 BB, 274 K, 2.52 ERA, 175 ERA+.

Take a look at that line again. Basically, he’s been an ace reliever.

Oliver’s last bad season was in 2004. He didn’t pitch in the majors in 2005, but since then has rattled off 7 straight years ranging from good to excellent. Over that period, he’s been worth 10 Wins Above Replacement as a middle reliever.

Just to give you an idea of how valuable Oliver has been, here are the leaders in WAR among non-closing relievers:

Rk Player WAR SV G From To
1 Octavio Dotel 15.4 109 752 1999 2012
2 LaTroy Hawkins 14.1 88 871 1995 2012
3 Rafael Betancourt 13.6 58 603 2003 2012
4 Matt Thornton 10.4 23 546 2004 2012
5 Scott Downs 9.9 26 496 2000 2012
6 Sean Marshall 9.4 16 365 2006 2012
7 Mike Adams 9.3 4 358 2004 2012
8 Joaquin Benoit 9.1 13 475 2001 2012
9 Jesse Crain 8.5 4 494 2004 2012
10 Jeremy Affeldt 8.4 28 621 2002 2012
Provided by Baseball-Reference.com: View Play Index Tool Used
Generated 1/17/2013.

Oliver himself didn’t qualify for this list since he was primarily a starter before his renaissance.

If we look at just 2006-2012, since Oliver has been reborn as a reliever, here are the top WAR totals among non-closing relievers:

Rk Player WAR SV G From To
1 Rafael Betancourt 11.1 52 448 2006 2012
2 Matt Thornton 10.1 23 472 2006 2012
3 Scott Downs 10.0 26 438 2006 2012
4 Darren Oliver 10.0 5 410 2006 2012
5 Sean Marshall 9.4 16 365 2006 2012
6 Mike Adams 8.0 3 299 2006 2012
7 Brad Ziegler 7.3 19 323 2008 2012
8 Grant Balfour 7.1 34 343 2007 2012
9 Darren O’Day 7.1 2 255 2008 2012
10 David Robertson 6.8 5 269 2008 2012
Provided by Baseball-Reference.com: View Play Index Tool Used
Generated 1/17/2013.

Any way you slice it, this guy is among the best middle relievers going into 2013.

What goes around comes around: guys who scored most often when getting on base

I posted this list in the comments to an earlier thread, but it really seems to deserve its own post.

Here are the players since 1901 who scored the highest percentage of time once reaching base (including reaching on error) with a minimum of 4000 career plate appearances.

1	Red Rolfe	48.8%
2	Jack Smith	47.2%
3	Pepper Martin	46.9%
4	Earle Combs	46.5%
5	Tommy Leach	45.3%
6	Joe DiMaggio	45.2%
7	C Granderson	45.2%
8	Ian Kinsler	44.4%
9	Lou Gehrig	44.2%
10	Hughie Critz	44.0%
11	Ray Chapman	44.0%
12	Tom Goodwin	43.7%
13	Babe Ruth	43.7%
14	Tommy Henrich	43.7%
15	C Gehringer	43.5%
16	Chuck Klein	43.4%
17	Kenny Lofton	43.3%
18	Earl Averill	43.3%
19	Alex Rodriguez	43.0%
20	Fred Clarke	42.9%
21	Donie Bush	42.8%
22	Vince Coleman	42.7%
23	F Lindstrom	42.7%
24	Kiki Cuyler	42.6%
25	Bobby  Bonds	42.6%
26	Bill Cissell	42.6%
27	Jimmie Foxx	42.6%
28	Pete Fox	42.5%
29	Jimmy Rollins	42.5%
30	Ron Gant	42.5%

This is quite an eclectic group, huh?

The research was sparked by reader kds noticing that Kenny Lofton had a very high percentage, and indeed he clocks in at #17. Some other leadoff-type speedsters make it too, with Bobby Bonds, Vince Coleman, Tom Goodwin(!), Jimmy Rollins, and others. Then there are other guys with a lot of home runs–obviously that’s an automatic 1-for-1 in terms of scoring when reaching base–Babe Ruth, Alex Rodriguez, Jimmy Foxx, etc.

I’m sure there’s a lot more we can glean from this…have at it.

Reliving the hits: how hit distribution has changed in MLB history

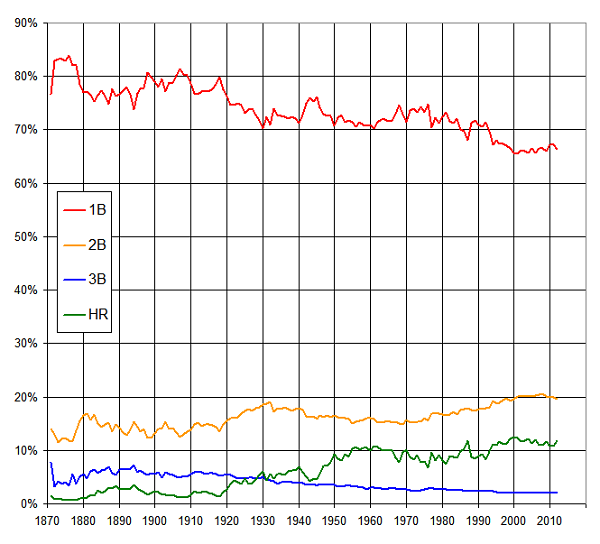
Here’s a pretty simple graph showing the breakdown each year of hits distribution.

hitpercentage


So, for any given year, this shows the percentage of total hits for that year that were singles, doubles, triples, or homers.

Some observations / conclusions:

  • Singles have, understandably, fallen off considerably. At the dawn of the game, they represented more than 80% of all hits but in recent years have been right around two-thirds. 2012’s percentage of 66.4 is among the lowest ever–just slightly above figures between 65 and 66 in the 2000’s.
  • Triples increased in the 1880s and 1890s but have declined pretty steadily since except for renaissances in the 1910s and 1970s. The rate has hovered right around 2% for several years now.
  • Doubles are quite interesting. You might have expected that they peaked in the late 1990s or early 200s (like homers) but their two peak seasons are actually 2007 and 2008, at 20.4% and 20.5% respectively. Doubles are off a bit in the last couple of years, probably largely because home runs have spiked again.
  • Homers took a huge upward turn when Babe Ruth came on the scene, then took subsequent big jumps in the 1940s and the 1990s. They peaked in 2000 at 12.6%, fell as low as 10.8% in 2011 but rebounded last year to 11.8%.
  • 1987 shows up again as a really fluke year. Home runs spiked up that year (then back down in 1988) and singles spiked way down (and then back up in 1988).

I wonder what singles will look like 50 years from now. The decline has been remarkably linear so far, losing just about 8/10ths of a percentage point each decade. I’m sure that rate will slow, or else singles will account for fewer than half of all hits by about the year 2206. (Although this is an accurate projection from the data, rest assured that my tongue is planted firmly in my cheek right now.)

One and done: the best players to fall off the Hall of Fame ballot after their 1st year of eligibility

Kenny Lofton / Kelley L Cox-USA TODAY Sports

Kenny Lofton / Kelley L Cox-USA TODAY Sports

With Kenny Lofton receiving a miserable 3.2% of the vote in yesterday’s Hall of Fame balloting, he’s gone from future consideration despite 6 All-Star appearances, 4 Gold Gloves, and 64.9 career WAR (greater than the totals of more than 50 players already enshrined.)

With a hat tip to @phungo2008 for asking the question, here are the players with the highest career WAR totals who fell off the Hall of Fame ballot in their first year of eligibility:

Lou Whitaker    (71.4 WAR, 2.9% in 2001)
Bill Dahlen     (70.9 WAR, 0.4% in 1938)
Bobby Grich     (67.3 WAR, 2.6% in 1992)
Kenny Lofton    (64.9 WAR, 3.2% in 2013)
Kevin Brown     (64.3 WAR, 2.1% in 2011)
Willie Randolph (63.0 WAR, 1.1% in 1998)
Buddy Bell      (61.6 WAR, 1.7% in 1995)
Reggie Smith    (60.8 WAR, 0.7% in 1988)
David Cone      (58.8 WAR, 3.9% in 2009)
Sal Bando       (57.1 WAR, 0.7% in 1987)

A new notes:

  • All of these guys fell off the ballot because they didn’t receive 5% of the vote. There are other players with higher WAR totals, such as Ken Boyer and Wes Ferrell, who received less than 5% in their 1st year but didn’t fall off the ballot because the rules were different.
  • There are a bunch of 19th-century players, Jim McCormick chief among them, who have enough WAR to qualify but were never listed on any HOF ballot.
  • And of course, Pete Rose and Shoeless Joe Jackson would make this top 10 but also have never appeared on any HOF ballot.

Batting Split Finder (new at Baseball-Reference.com)

Sean has added a Batting Split Finder which, right now, is available here:

http://www.baseball-reference.com/play-index/split_finder.cgi

It’s currently beta but should launch officially next week, along with a Pitching Split Finder.

Here are a few tweets I’ve made today using the new tool:

  • Most HR at home in 2012: Miguel Cabrera 28, Curtis Granderson 26. Most HR away in 2012: Adam Dunn 21, IkeDavis/Hamilton/Stanton 21
  • Most HRs coming on an 0-2 pitch over the last 5 years: Miguel Cabrera 11, R Braun V Wells A Soriano 10, K Morales M Kemp 9
  • Most HRs coming on an 3-0 pitch over the last 5 years: J Upton 5, M Napoli B Butler 4
  • Most career home runs leading off an inning: Barry Bonds 184, Rafael Palmeiro 151, Hank Aaron 149, Mark McGwire 148, Rickey Henderson 142
  • Most times striking out as 1st batter of the game since 1916: Henderson 408, Brock 362, Tony Phillips 249, Biggio & BOBBY Bonds 233
  • Most RBI in Sep/Oct last season: Chase Headley 32, Miguel Cabrera 30, C Granderson 27, Torii “Homophobe” Hunter 27
  • Most HR in 2012 when facing the starting pitcher for the 4th+ time in the game: Mike Trout 4, Ryan Bruan & Zack Cozart 3
  • Most HR in 2012 when facing the starting pitcher for the 1st time in the game: Granderson 14, Carlos Beltran & AJ Pierzynski 12
  • Over the last 20 years, most triples while batting 4th: Jeff Kent 30, Vlad Guerrero 27, Larry Walker 20, Bernie Williams 19, Scott Rolen 18

Update

You may have seen our big project launch yesterday, and then seen it was promptly canceled about an hour into it. I came to realize that even though I think our proposed work didn’t break any laws I was likely in for some massive headaches nevertheless. This is pretty devastating for me, as I spent a couple hundred hours and a lot of money prepping that project. At this point, I am going to resume my retirement. I don’t know what this means for the future of High Heat Stats, but without a funding source the site cannot continue as I am currently paying out of pocket.

40 years ago today: The Trade Parade

Forty years ago today, on November 30, 1972, there were 9 trades in MLB:

The Detroit Tigers traded Jim Foor and Norm McRae to the Pittsburgh Pirates for Dick Sharon.

The Chicago Cubs traded Bob Maneely (minors), Joe Decker and Bill Hands to the Minnesota Twins for Dave LaRoche.

The Texas Rangers traded Horacio Pina to the Oakland Athletics for Mike Epstein.

The Texas Rangers traded Tom Ragland to the Cleveland Indians for Vince Colbert.

The Philadelphia Phillies traded Joe LisKen Reynolds and Ken Sanders to the Minnesota Twins for Cesar Tovar.

The San Diego Padres traded Al Severinsen to the New York Mets for Dave Marshall.

The Cincinnati Reds traded Hal McRae and Wayne Simpson to the Kansas City Royals for Roger Nelson and Richie Scheinblum.

The Cleveland Indians traded Terry Wedgewood (minors) and Del Unser to the Philadelphia Phillies for Roger Freed and Oscar Gamble.

The Atlanta Braves traded Taylor Duncan and Earl Williams to the Baltimore Orioles for Pat DobsonRoric HarrisonDavey Johnson and Johnny Oates.

Some notes on these trades:

  • Two different McRaes were traded
  • All-Stars: LaRoche, Hal McRae, Simpson, Scheinblum, Dobson, Johnson
  • Players w/ memorable nicknames: Superjew, Pepito, Spider
  • Future managers: McRae, Johnson, Oates

The worst players to post a 5+ WAR season

In the last 30 seasons (1983-2012) there are 169 now-retired players to have registered at least 1 season worth 5 Wins Above Replacement. This group is led by Barry Bonds, who did it a whopping 17 times, and Ken Griffey, who did it 9 times. The players atop that list are among the best to have played MLB in the last 3 decades.

But by looking at things a bit differently, we can come up with some surprising names among that same group. Continue reading

1992 vs 2012: The game has changed a lot in 20 years

As the Steroids Era has faded away, offensive levels have returned quite close to where they were in 1992, The Year Before Everybody Got Jacked. On the surface, the two seasons look pretty similar in terms of numbers:

Stat              1992      2012
BA                .256      .255
AB per game     33.93     34.00
Hits per game    8.68      8.65
Runs per game    4.12      4.32

While those basic numbers are just about mirror images, there are some massive differences as well.

Continue reading