Author Archives: Andy

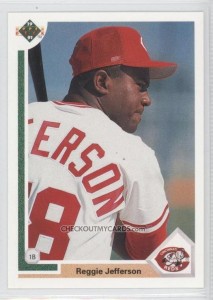
Reggie Jefferson: the High Heat Stats interview @ReggieJefferson

Reggie Jefferson played 9 seasons in the majors and is the closest to a .300 hitter you’ll ever see. With 637 hits in 2,123 career at-bats, his final MLB batting average is 0.300047.  Jefferson also had a lot of power, posting a career .474 SLG and 112 OPS+.

Jefferson played for 4 teams in the big leagues plus 1 year in Japan. In 320 games for Boston from 1996 to 1998, he hit .327/.372/.524 with a 127 OPS, including a wicked awesome 1996 in which he batted .347 with a 143 OPS+.

Read below to find out how a front-office blunder cost the Reds his rights, which player on the stacked early 1990’s Indians he thinks is the best, and why he gave up switch-hitting.

These days Jefferson (follow him on Twitter @ReggieJefferson) works as a player agent with SFX Baseball Group, one of the leading representative groups for MLB players.

Jefferson (virtually) sat down with us to answer a few questions about his career.

Continue reading

How do some players maintain such high BAbips?

Some players seem to be able to maintain really high BAbips (batting average on balls in play.) It’s one thing for a guy like Ichiro to do it…he has a .347 career BAbip, which is really high, but not so much higher than his career BA of .322.

Here are active players (minimum 2000 plate appearances) with BAbips at least 20% higher than their batting averages, minimum .296 BAbip, which is league average for 2012 only.

Rk Player BAbip BA PA From To
1 Shin-Soo Choo .354 .290 2760 2005 2012
2 Dexter Fowler .346 .268 2013 2008 2012
3 Michael Bourn .345 .275 3192 2006 2012
4 Wilson Betemit .341 .268 2313 2001 2012
5 Chase Headley .338 .270 2610 2007 2012
6 Jack Cust .337 .242 2581 2001 2011
7 Brad Hawpe .337 .276 3369 2004 2011
8 Justin Upton .336 .276 2847 2007 2012
9 Jayson Werth .326 .266 3743 2002 2012
10 B.J. Upton .324 .255 3859 2004 2012
11 Mark Teahen .324 .264 3171 2005 2011
12 Alex Gordon .322 .268 2850 2007 2012
13 Jeremy Hermida .314 .257 2261 2005 2012
14 Bill Hall .310 .248 3674 2002 2012
15 Kelly Johnson .309 .257 3631 2005 2012
16 Mark Reynolds .309 .235 3248 2007 2012
17 Rickie Weeks .306 .251 3800 2003 2012
18 Ronny Cedeno .299 .248 2440 2005 2012
19 Russell Branyan .296 .232 3398 1998 2011
Provided by Baseball-Reference.com: View Play Index Tool Used
Generated 8/13/2012.

Kind of a neat list, huh? It’s got some fast guys like Fowler and Bourn, who (like Ichiro) probably get a high BAbip because they are able to beat out a higher fraction of infield grounders). It also includes some three true outcome guys like Cust, Reynolds, and Branyan, who don’t necessarily put the ball in play that much, have low batting averages, and hit a higher rate of balls out of the park.

It is, in fact, these TTO guys who have the highest increase of BAbip over  BA. Cust is tops, with a BAbip 39% higher than his BA. The rest of the leaders among the list above are Reynolds (31%), Fowler (29%), Branyan (28%), and Betemit (27%).

It’s been 5 years since Barry became king

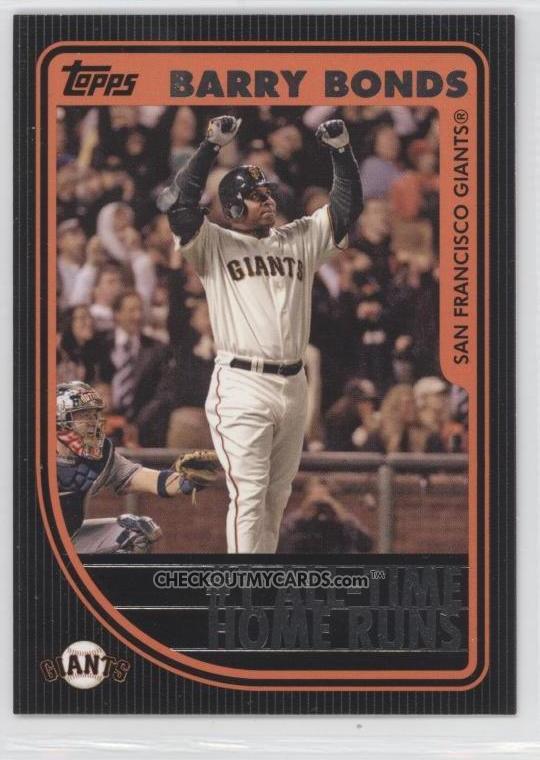
My how time flies. It was 5 years ago today that Barry Bonds passed Hank Aaron as the all-time home run leader among MLB players.

2007 Topps Update Barry Bonds 756 #HRK

I’ve got two questions–how did you feel then and how do you feel now?

Then–I didn’t care. Even more than that, I went out of my way to avoid news of it and acted like it was even happening. I hated Bonds as a person, hated Selig as commissioner, hated everything about the whole thing. I practically vomited in my mouth thinking about the spectacle that would ensue when it happened. I didn’t look at Barry Bonds as the poster child of steroids–I knew lots of people used them–but I certainly didn’t want to give him any accolades and act like it never happened.

Now–I still don’t appreciate Bonds as a person but I am a lot more comfortable accepting him as the home run king. Yes, he cheated. He deserves a major knock as a person for that. But lots of other players cheated, and the fact is that he has hit the most MLB homers. That’s a simple fact. Lots of factors have affected baseball records. Ted Williams would have given Babe Ruth a run for his money as HR king had he not lost more than 4 years to military service. Had Glenn Davis played in Fenway park and not the Astrodome, he probably would have been a superstar. Hundreds of players have used amphetamines dating back 50 years. I don’t like Bonds, but he is what he is–the all-time MLB HR leader.

What was it like for you then, and what’s it like now?

Out with a bang, out with a whimper

Out with a bang

Here are retired players since 1901 with the highest OPS+ values in their final season (minimum 200 plate appearances):

Rk Player OPS+ PA Year Age Tm G AB R H 2B 3B HR RBI BA OBP SLG Pos
1 Ted Williams 190 390 1960 41 BOS 113 310 56 98 15 0 29 72 .316 .451 .645 *7
2 Shoeless Joe Jackson 172 649 1920 32 CHW 146 570 105 218 42 20 12 121 .382 .444 .589 *7/9
3 Barry Bonds 169 477 2007 42 SFG 126 340 75 94 14 0 28 66 .276 .480 .565 *7/D
4 Joe Adcock 167 265 1966 38 CAL 83 231 33 63 10 3 18 48 .273 .355 .576 *3
5 Will Clark 145 507 2000 36 TOT 130 427 78 136 30 2 21 70 .319 .418 .546 *3/D
6 Mickey Mantle 143 547 1968 36 NYY 144 435 57 103 14 1 18 54 .237 .385 .398 *3
7 Happy Felsch 143 615 1920 28 CHW 142 556 88 188 40 15 14 115 .338 .384 .540 *8
8 Dave Nilsson 141 404 1999 29 MIL 115 343 56 106 19 1 21 62 .309 .400 .554 *2/D
9 Brian Downing 138 391 1992 41 TEX 107 320 53 89 18 0 10 39 .278 .407 .428 *D/4
10 Roberto Clemente 138 413 1972 37 PIT 102 378 68 118 19 7 10 60 .312 .356 .479 *9
11 Buzz Arlett 138 469 1931 32 PHI 121 418 65 131 26 7 18 72 .313 .387 .538 *93
12 Steve Evans 138 638 1915 30 TOT 151 556 94 171 34 10 4 67 .308 .392 .426 *9/3
13 Joe Riggert 135 270 1919 32 BSN 63 240 34 68 8 5 4 17 .283 .356 .408 *8
14 Frank Huelsman 135 465 1905 31 WSH 121 421 48 114 28 8 3 62 .271 .333 .397 *7/9
15 Reggie Smith 134 398 1982 37 SFG 106 349 51 99 11 0 18 56 .284 .364 .470 *3
16 Frank Schulte 134 328 1918 35 WSH 93 267 35 77 14 3 0 44 .288 .406 .363 *97/8
17 Bill Keister 133 429 1903 31 PHI 100 400 53 128 27 7 3 63 .320 .352 .445 *9
18 Butch Nieman 132 291 1945 27 BSN 97 247 43 61 15 0 14 56 .247 .361 .478 79
19 John Titus 132 317 1913 37 BSN 87 269 33 80 14 2 5 38 .297 .392 .420 *9
20 Hank Greenberg 131 510 1947 36 PIT 125 402 71 100 13 2 25 74 .249 .408 .478 *3
Provided by Baseball-Reference.com: View Play Index Tool Used
Generated 8/4/2012.

It’s a beautiful thing that these seasons are so spread across baseball history. Check out the league leaders, too: Shoeless Joe led the league in triples, Barry Bonds led in OBP, and Steve Evans led in doubles.

Brian Downing stuck it to the Angels with a strong finish in Texas. Dave Nilsson wanted to go home to Australia and quit MLB while he was still doing really well. Ted Williams finished his career on a homer. Will Clark was an amazing late-season pickup for the Cardinals. Roberto Clemente was still playing really well before dying during the off-season.

That’s a list of (mostly) great players with (mostly) great stories about how they finished up.

Out with a whimper

Here are retired players since 1901 with the lowest OPS+ values in their final season (minimum 200 plate appearances):

Rk Player OPS+ PA Year Age Tm Lg G AB R H 2B 3B HR RBI BA OBP SLG Pos
1 Bill Bergen -3 250 1911 33 BRO NL 84 227 8 30 3 1 0 10 .132 .183 .154 *2
2 John Black 6 201 1911 21 SLB AL 54 186 13 28 4 0 0 7 .151 .202 .172 *3
3 Doug Strange 14 201 1998 34 PIT NL 90 185 9 32 8 0 0 14 .173 .217 .216 5/43
4 Hughie Critz 18 227 1935 34 NYG NL 65 219 19 41 0 3 2 14 .187 .198 .242 *4
5 Benny Zientara 24 203 1948 30 CIN NL 74 187 17 35 1 2 0 7 .187 .236 .214 *4/56
6 Jim Levey 24 567 1933 26 SLB AL 141 529 43 103 10 4 2 36 .195 .237 .240 *6
7 Harry Pearce 25 260 1919 29 PHI NL 67 244 24 44 3 3 0 9 .180 .209 .217 *46/5
8 Bob Dernier 27 205 1989 32 PHI NL 107 187 26 32 5 0 1 13 .171 .225 .214 879
9 Jim McLeod 27 251 1933 24 PHI NL 67 232 20 45 6 1 0 15 .194 .237 .228 *5/6
10 Tom Donohue 28 230 1980 27 CAL AL 84 218 18 41 4 1 2 14 .188 .216 .243 *2
11 Mike Balenti 29 227 1913 26 SLB AL 70 211 17 38 2 4 0 11 .180 .206 .227 *6/7
12 Joe Wagner 30 210 1915 26 CIN NL 75 197 17 35 5 2 0 13 .178 .210 .223 *46/5
13 Kevin Polcovich 32 238 1998 28 PIT NL 81 212 18 40 12 0 0 14 .189 .255 .245 *64/5
14 Mike Guerra 32 270 1951 38 TOT AL 82 246 21 48 2 1 1 22 .195 .261 .224 *2
15 Charlie French 32 229 1910 26 TOT AL 54 210 21 36 2 1 0 7 .171 .223 .190 *49
16 John Godwin 33 209 1906 29 BOS AL 66 193 11 36 2 1 0 15 .187 .215 .207 56/9483
17 Bill Lauterborn 33 219 1905 26 BSN NL 67 200 11 37 1 1 0 9 .185 .238 .200 54/68
18 Alan Trammell 34 207 1996 38 DET AL 66 193 16 45 2 0 1 16 .233 .267 .259 *64/57
19 Pat Putnam 34 212 1984 30 TOT AL 78 193 12 34 7 0 2 20 .176 .236 .244 *D7/3
20 Bob Uecker 34 221 1967 32 TOT NL 80 193 17 29 4 0 3 20 .150 .243 .218 *2
Provided by Baseball-Reference.com: View Play Index Tool Used
Generated 8/4/2012.

These seasons are also spread around a lot, although none are more recent than 1998. I think that teams have become extremely reluctant to give much playing time to guys who can’t do anything with the bat. This makes sense during the really high-scoring era of the 2000s, when defense mattered a little less because saving 1 run mattered a little less.

If you skimmed the second list, you may have missed one name near the end: Alan Trammell. He’s the only guy on that second list with a career OPS+ over 97 (his was 110). Fangraphs has his wRC+ in that final season as 37, meaning he created runs at 37% of league average…abysmal.

Phillies phranchise phutility

With the Phillies stinking pretty bad in 2012, many folks are wondering if their recent run of success is over or if this year is just a blip. (With their team getting old and 3 playes signed to huge over-market deals, I tend to think it’s not a blip.)

I’m here to tell you that in the big picture, it doesn’t matter anyway.

Check out how many games over .500 the Phillies team has finished each year in its history:

Phillies’ number of games above .500 each year. Click on the image for a larger version.

As you can see, this team has been bad more often than good and went through an abysmal stretch from 1918 through 1948 where they were under .500 (usually WAY under .500) every year except one.

The Phillies’ success over the last decade is clearly their best run ever, edging out the one from the mid 1970s through the early 1980s.

But if we look at cumulative number of games under .500, it ain’t pretty:

Phillies’ cumulative games over .500 in franchise history. Click for a larger version.

Oh…it’s bad. Once the losing started in 1918, they took a massive plunge. The “good” news is that once they reached that first trough in 1948, they’ve lost only a cumulative 200 further games since then, and actually gained most of that back in the 10 years before 2012.

Realize, though, that at more than a thousand games under .500, the team would have to go 101-61 for each of the next 25 years just to break even. Wow.

More quotes from “The Hall of Nearly Great”

High Heat Stats is an affiliate for The Hall of Nearly Great. Follow that link to purchase a copy of the book, and you’ll be supporting this blog as well.

Following are some selected quotes from the electronic book. Please consider purchasing a copy (for just $12!) to support not only a great collection of essays, but also the concept of crowd-sourcing great efforts like this. Note that the baseball card images below are from checkoutmycards.com and are not reprinted in the ebook itself.

Joe Posnanski on Dale Murphy:

“That’s what I mean when I say that Murphy represented the ideal baseball player. He did not drink, did not smoke, and would always pick up the check. He would not give television interviews with his shirt off. The man endorsed milk, for crying out loud.”

Wendy Thurm on Bobby Bonds:

“There must have been a time when Barry Bonds was known as Bobby Bonds’ son. At some point, that changed.”

Jeff Passan, interviewing Marvin Miller for his essay on Andy Messersmith:

‘How are you, Marvin?’ I ask.    ‘Not good,’ he says.

Marvin Miller is 95. He’s tired these days. He says he doesn’t have much time. I tell him I’d like to talk about Andy Messersmith. He talks for 30 minutes straight.”

Sam Miller on Brian Downing:

“Christopher Reeve resemblance aside, Superman isn’t the right superhero for Downing, and neither is the Incredible Hulk. Those guys were strong because of circumstances out of their control; they were merely the vehicles through which power flowed. Every major leaguer worked hard, works hard, puts in effort that we can’t imagine. But they’re, at their core, Superman. They’re the Hulk. They’ve been given their talent. Downing is, if any superhero, Batman: a self-invented force of will. He did something all of us could do, but that, in the end, none of us can do.”


Still not convinced you should buy The Hall of Nearly Great? Read my first review of the book for more excerpts and a more detailed explanation of why this project is so well worth supporting.

MLB attendance is at a record high (fractional capacity)

Using ESPN.com’s attendance data I calculated total attendance as a fraction of capacity for each year going back to 2001 (as far back as ESPN has the data). In brief, I made sure it was weighted properly by essentially finding the total number of seats available at all games in all ballparks, then taking the total actual MLB attendance as a fraction thereof.

So far in 2012, 72.9% of all seats have been sold, the highest number in the entire available range back to 2001. Leaders are the Red Sox and Phillies, both of whom apparently are overselling capacity (though this is known to be a sham in Boston’s case, as local ticket agencies are required to buy up any unsold tickets for each game and Fenway itself rarely close to full on game day.)

Here is the fraction of total capacity sold each year:

2012	72.9
2011	70.0
2010	68.3
2009	68.2
2008	72.1
2007	72.4
2006	69.4
2005	69.4
2004	67.3
2003	60.4
2002	60.2
2001	64.3

Attendance reached a high (in both absolute numbers and fraction) in 2008, then started to decline as the US recession deepened. Since then, the economy has improved slightly, but capacity has also shrunk with, for example, the new (smaller) Yankee Stadium opening.

As average game attendance every season prior to 2001 was lower than the average in 2012, I think it’s a reasonable guess that fraction of capacity was also lower in all those earlier seasons. The only seasons with a higher average attendance that 2012 were 2007 and 2008, and as we can see, the fraction of capacity is higher in 2012. Of course, as the year drags on and more and more teams fall out of contention (or trade their stars as will happen in the next couple of days), attendance is likely to fall in many places and 2012 may fall out of first place.