There’s a player who’s not in the Hall of Fame, even though his career Wins Above Replacement (WAR) is: six more than the average HOF position player; more than 13 of the 18 HOF second basemen; and more than any other eligible HOF reject besides PED suspects.
The reason usually given for his exclusion is that he had no great years and few truly outstanding ones. I’m not here to dispute that point, and this article is not an argument for putting him in the Hall.
Instead, I’m exploring whether Lou Whitaker was the most consistently “good” position player in MLB history.
Caveats:
- This analysis focuses on WAR, using the Baseball-Reference method. If you prefer the FanGraphs method, know that Whitaker rates a little better over there. If you’re skeptical of defensive WAR ratings, know that
more than 80%77% of Whitaker’s WAR value comes from offense; WAR agrees with the popular view that Whitaker was a good, not great, defender. (For instance, among all 2Bs in the 1980s, Whitaker and Willie Randolph are tied for 2nd in dWAR, but far behind #1 Frank White and very close to the #4-5 guys.) - You may know that I’m a Tigers fan, that Whitaker broke in when I was 13, and that I have advocated his election to the Hall of Fame. I’m trying hard to be objective here, but it won’t surprise me if you find some hint of bias.
Number of “good” seasons
Has anyone produced more “good-but-not-great” seasons than Whitaker? In his 19-year career, Whitaker had:
- Twelve seasons with 3.0 to 5.0 WAR — the most such years in MLB history. (Three others had 11, and two had 10.)
- Fifteen seasons with 3.0 to 7.0 WAR — again, the most such years in MLB history. (Two others had 14, and two had 13.)
Why those WAR ranges? The floor of 3.0 WAR is a generally accepted standard for a good season by a regular. (See chart.) In a given year, between one-quarter and one-third of those playing 100+ games will register at least 3.0 WAR; it was 29% last year, 28% since 2000, 27% during Whitaker’s career. (The 3-WAR floor is unfair to players before 1884, when the schedule was much shorter, but I can’t help that; if you want to show that Joe Start fits this bill better than Whitaker, go to it.)
I set the first ceiling at 5.0 WAR representing the rough minimum for MVP selection. During Whitaker’s career, 31 of 35 position-player MVPs had at least 5.0 WAR. A player with 3 to 5 WAR has a good chance of being an All-Star, but is unlikely to be in the MVP discussion.
I set the second ceiling at 7.0 WAR representing the rough minimum for a league leader. During Whitaker’s career, 34 of 38 league WAR leaders had at least 7.0 WAR, and all had at least 6.4. There were about four 7-WAR seasons per year during Whitaker’s career.
So Whitaker has a claim to the most “good-but-not-great” seasons. How does he fare on consistency?
Consistency of “good-or-better” seasons
For this test, I set a preliminary standard of 100+ games, and a secondary standard of 2+ WAR per 100 games (which of course equates with 3 WAR per 150 games). I gathered the players with the most years of 100+ games, then counted the times they reached that WAR rate.
There are 199 players who had at least 14 seasons of 100+ games.
Nine of them met the WAR standard in every one of those years. Eight of those nine are inner-circle HOFers, or at least have the 100-WAR credential; the other is Jeff Bagwell. All of them had many great seasons. (Even Bags had four 7-WAR years, which only 36 other players in history have done.)
These next seven players met the 2-WAR/100-G standard in all but one of their 100-game seasons. They’re ordered by number of years meeting the standard, with their career WAR/100 in parentheses:
- 18 — Honus Wagner (4.5), Frank Robinson (3.6)
- 17 — Eddie Collins (4.2)
- 15 — Alex Rodriguez (4.4), Lou Whitaker (3.0)
- 14 — Ted Williams (5.2), Jimmie Foxx (4.0)
Again, all these guys enjoyed many great seasons — all cleared 90 career WAR with ease, and are (or will be) HOFers — except Whitaker.
The point: Almost all players have significant ups and downs in their career, so those who consistently reach a given WAR threshold almost have to average quite far above that threshold. Whitaker is the leading exception to that rule.
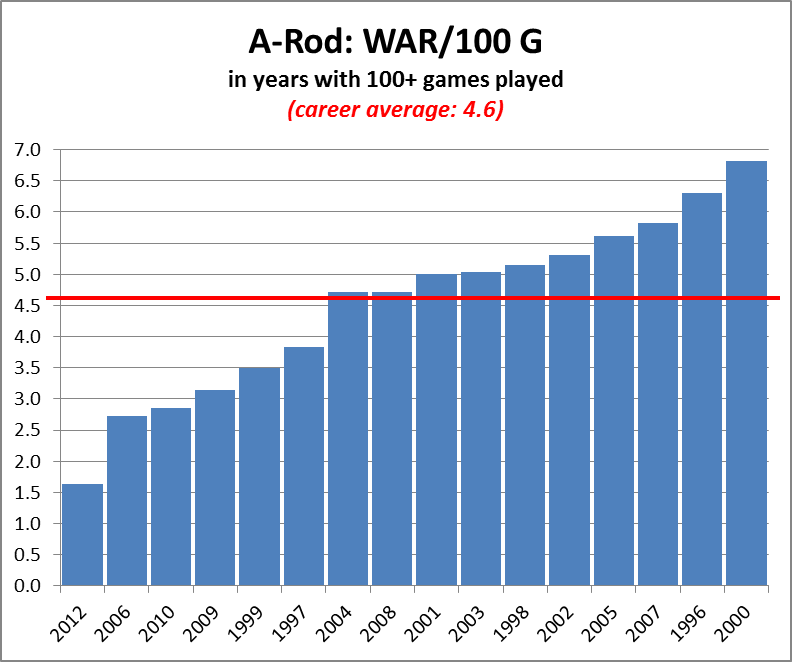
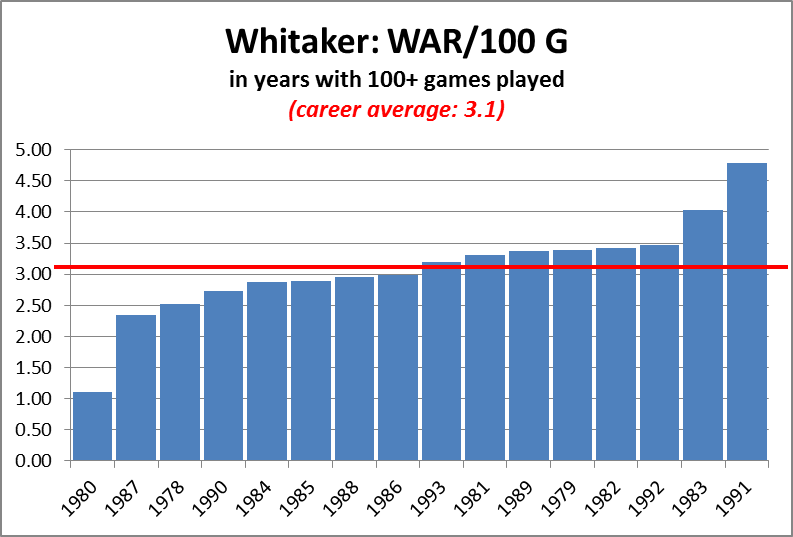
Compare these charts of Sweet Lou and A-Rod, who both have 16 years of 100+ games, with 15 of those at 2+ WAR per 100 games. The charts show each player’s 100-game seasons only, not chronologically but ordered by WAR/100 G, from lowest to highest. The red line represents their career average of WAR/100 G.
First, the superstar:
As shown before, A-Rod has been very consistent, meeting the “good” standard in all but one of his 100-game years. Even so, his chart shows a fair amount of variation from his career average.
Now, Sweet Lou:
Eleven of Whitaker’s 16 full years fall within a range of +/- 12% of his career average. Throw out his high and his low year, and the other 14 fall within +/- 31% of his career average. Now, that’s consistency.
____________________
So far, we’ve looked at frequency and consistency of good seasons, and Whitaker’s seems to have a strong claim to the title in question. In Part 2, I will:
- look at the rarity of amassing so much WAR without any great seasons;
- compare Whitaker to his contemporaries, both at second base and beyond; and
- look for current players who fit this mold.


