Quiz – Heavy Hitters

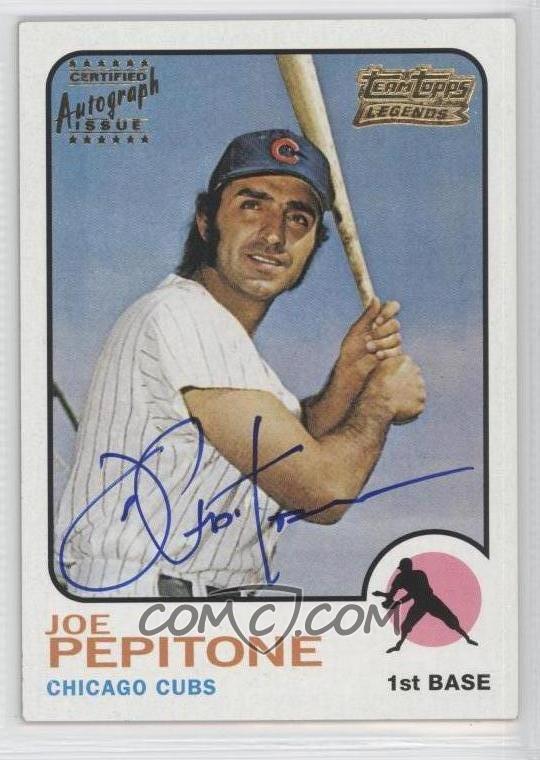
Below are a list of similar hitters. Except for maybe one, that first guy. All but Pepi have had seasons of 40 HRs, over 100 RBI, or over 100 Ks.

So what is it that only this group of hitters has accomplished in a full season (502 PA) since 1901?

Congratulations to Paul E. He correctly identified these players as the only hitters since 1901 having a season (502 PA) with home runs comprising more than 55% of runs scored. Here’s the list.

0 0 votes
Article Rating
Subscribe
Notify of
guest

63 Comments
Oldest
Newest Most Voted
Inline Feedbacks
View all comments
Hartvig
Hartvig
12 years ago

At least half of those guys are follically challenged- do it have anything to do with hairpieces?

Matthew Glidden
12 years ago

Are IBB & GIDP factors in the answer? It’s not a super-rare accomplishment to have more IBB than GIDP, but these guys all did it at least once.

Doug
Doug
12 years ago

No. That’s not part of it.

Paul E
Paul E
12 years ago

Scored more than 1/2 their runs in a season on their own homers

Doug
Doug
12 years ago
Reply to  Paul E

Almost got it, Paul. The fraction isn’t quite right.

Josh
Josh
12 years ago
Reply to  Doug

Over 55%? Not to steal Paul’s thunde, he did the bulk of the work.

Paul E
Paul E
12 years ago
Reply to  Doug

55% ??? I’m still trying to figure out how Terry Pendleton won the M V P Award in 1991

bstar
12 years ago
Reply to  Paul E

If you ever do figure out how Pendleton won, Paul, please let me know. 🙂

John Autin
Editor
12 years ago
Reply to  bstar

The ’91 Braves went from last to first. Pendleton went from .230 to the batting title (he also led in total bases). He was their best position player, by far. The pull of that storyline was irresistible — I feel myself getting sucked in even from this distance. The two best positional candidates for the ’91 MVP (Bonds & Sandberg) had already won one, plus both had slightly worse years than the year before. Larkin missed almost 40 games, plus he and Ryno played for losing teams. All in all, Pendleton’s selection seems quite predictable, given what we know about… Read more »

bstar
12 years ago
Reply to  bstar

I was mainly kidding, JA, but it’s always good to relive that wonderful time in Braves history. I was just pointing out that even a Braves fan at the time thought Barry Lamar deserved the trophy.

Bonds led the league in OBP, OPS, OPS+, WAR, stole 43 bags, played superb defense in left, and had more HR/BB/RBI/R than Pendleton. I understand the narrative surrounding Pendleton was strong, but I still don’t agree with it.

no statistician but
no statistician but
12 years ago
Reply to  bstar

Among position players Pendleton finished in the top four in WAR, and the difference among those four as batters wasn’t really all all that great. Further, looking at Atlanta as a team, the next highest WAR after Pendleton’s 5.8 overall is Otis Nixon’s at 1.9. As for Bonds on the other division champion, he had 3 teammates with 3.3 WAR or better, 5 with 2.2 or better. I don’t know whether Pendleton deserved the award—I sort of remember thinking it odd at the time—but it seems to me that he was probably more valuable to the Braves than Bonds was… Read more »

Doug
Doug
12 years ago
Reply to  bstar

Wow, Larkin with 5.9 WAR (4.8 oWAR) in just 123 games.

bstar
12 years ago
Reply to  bstar

The real Braves MVP that year was Tom Glavine. Counting his hitting exploits, Glavine amassed 9.0 WAR in ’91, 55% more than Terry Pendleton.

Ed
Ed
12 years ago
Reply to  bstar

I think the ’91 Braves are a great example of why people still don’t trust the WAR defense numbers. Here’s a team which came out of nowhere to win the pennant, largely based on the strength of their pitching. And yet, according to the defensive numbers, those pitchers were backed by an atrocious defense. WAR shows the defense costing the Braves 98 runs (nearly 10 wins). Prime contributors were Ron Gant (-27), Jeff Blauser (-18), Dave Justice (-14), Jeff Treadway (-9), Lonnie Smith (-9), and Deion Sanders (-8). Most of these guys, btw, have positive numbers for their career (Blauser… Read more »

mosc
mosc
12 years ago
Reply to  bstar

Preach it Ed! Hell yes!

Ed
Ed
12 years ago
Reply to  bstar

Thanks Mosc! It’s actually worse than I originally suspected. In 1990, the Braves were awful at both pitching (4.58 ERA, 12th in the NL) and fielding (-58 fielding runs). Somehow in 1991, their pitching dramatically improved (3.49 ERA, 3rd in the NL) while simultaneously their defense deteriorated (-98 fielding runs). And are you ready for this? Their worst fielder in 1990 was 3rd baseman Jim Presley (-21 fielding runs); they replaced him in 1991 with Terry Pendleton who was their best fielder that year (+7 fielding runs). Now please explain to me how all those parts work together. Replacing your… Read more »

bstar
12 years ago
Reply to  bstar

Ed, are you aware that traditional metrics also called the 1991 Braves a bad defensive team? They committed the third-most errors, were 10th out of 12 in fielding percentage, and were 9th in double plays. I understand that finding numbers that don’t seem to agree with the eye test or whatever are an easy target to those who question newer defensive metrics, but if the traditional ones AND the eye test both agree that this Braves team was bad defensively, I don’t get the argument. Treadwell was awful, Blauser was overrated, Olson behind the plate was below average, David Justice… Read more »

Ed
Ed
12 years ago
Reply to  bstar

Fair points Bstar. However, consider the following years team. The ’92 Braves were +39 in fielding runs, a dramatic 137 run improvement over the prior year’s team. This occurred while using essentially the same team as the year before. Meanwhile their traditional fielding metrics didn’t change much. They went from 10th to 4th in fielding percentage but they only improved from .978 to .982 which probably means there were several teams bunched closely together one or both years. They did commit 29 fewer errors but obviously that’s not nearly enough to account for a 137 run defensive improvement. And they… Read more »

Ed
Ed
12 years ago
Reply to  bstar

I should note that the Braves also gave up 10 fewer home runs so that accounts for part of their improvement but not much.

bstar
12 years ago
Reply to  bstar

Hmm, for one thing I think you’re giving defense more credit for pitching success than I ever would. I’m convinced the number of batted balls where who the defender is actually matters is a lot lower than people realize. What explains the difference between ’90 and ’91? Well, Tom Glavine morphed into the best pitcher in the league, for one. Steve Avery improved his ERA over 200 points. If half of your top 4 shows dramatic improvement, why can’t a team’s pitching improve despite bad defense? Also, the Braves hired Leo Mazzone in June of 1990. Maybe you start to… Read more »

Ed
Ed
12 years ago
Reply to  bstar

I have a feeling we’re going to need to agree to disagree on this. Nevertheless, here are my responses: “I’m convinced the number of batted balls where who the defender is actually matters is a lot lower than people realize.” Gramatically speaking, I don’t understand this sentence. “Well, Tom Glavine morphed into the best pitcher in the league, for one. Steve Avery improved his ERA over 200 points.” I’m not really sure what it means to “morph” into one of the best pitchers in the league. Anyway, if we look at FIP, Glavine’s FIP improved by .74 which leaves .99… Read more »

Doug
Doug
12 years ago
Reply to  bstar

I think bstar’s point about the number of balls in play where it really makes a difference who the defenders are is just this: – all major league fielders will make routine plays with almost the same efficiency – difference between fielders then is mostly at the margins – a good fielder will turn a tough chance into an out, and the poor fielder won’t – if your pitching is better, then the % of BIP that are hit hard should drop; ergo, there should be more routine plays that even a poor defense can handle – thus, the answer… Read more »

bstar
12 years ago
Reply to  bstar

Haha, Ed @61 I agree the grammar on that sentence was awkward. I did spend a minute trying to say it better and decided it would have to do. Still, the point is pretty clear, as Doug stated it. I’ll leave it at that. As Doug’s conclusion states, I don’t know what else to say about how a team’s pitching can improve while they have a bad year defensively. That doesn’t seem unexplainable in the least. Then you raise an objection to my use of the word “morph”. Do I really have to explain this? That’s a very clear statement.… Read more »

MikeD
MikeD
12 years ago
Reply to  Doug

Just about to say more than 55%, bu not sure if that’s what he meant by not right fraction.

MikeD
MikeD
12 years ago
Reply to  Doug

I was thinking it was wrong since I did a quick look at Bonds’ record and I didn’t see a 55% season. Have to go back and look again.

BTW Pepitone only scoring 49 runs in a season where he drove himself in 27 times in more than 502 PAs? That has to be one of the lowest of all time, which makes me wonder who actually holds that “record?”

MikeD
MikeD
12 years ago
Reply to  MikeD

…and it was the obvious year when he his 73, but the runs scored was still very high at 129 that I must have skipped right by it.

Paul E
Paul E
12 years ago
Reply to  MikeD

RE: “That has to be one of the lowest of all time, which makes me wonder who actually holds that “record?” ”

Leo Cardenas scored 25 runs in 602 PA’s (!!) for the ’72 Angels. But, he only hit 6 homers. Not quite sure what “record” you’re speaking of? Perhaps fewest runs scored in a season with 25+ homers? It’s got to be Pepitone…BTW, that hairpiece had to be pretty tough on a hot day in St. Louis 🙁

MikeD
MikeD
12 years ago
Reply to  Paul E

It was fewest run scored minus HRs, You got it. Doug futher clarified below adding in Molina.

Jason Z
12 years ago
Reply to  Paul E

Give Pepitone some credit. He did introduce the electric
hair dryer to the locker room.

Paul E
Paul E
12 years ago
Reply to  Doug

Looking at Sosa’s cartoon stats, he had a stretch of 4 years with a total of 1,600+ total bases! Holy Chuck Klein, Batman!

PP
PP
12 years ago
Reply to  Paul E

Amazing in his 3 60+ homer season he never led the league.

PP
PP
12 years ago

Kong almost hit 50% for his career. 901/442.

PP
PP
12 years ago
Reply to  Doug

Interesting. I thought of McGwire but then I assumed he’d had maybe 1300 runs. In fact, I see now he was on base “only” 3018 times when if asked I would have said 3500 anyway. Check out Boggs, maybe he’s at the other end (?), 4445 TOB and “only” 1513 runs, which is 34%.

PP
PP
12 years ago
Reply to  PP

Actually, I went off track there trying to do 3 things at once, I see though McGwire scored almost 39% of his TOB, which I guess factors in all the home runs…

Richard Chester
Richard Chester
12 years ago

In 1997 McGwire had 58 HR and only 86 R. That calculates to 67.4% of his runs scored on his own HR, an ML record.

Jimbo
Jimbo
12 years ago

also remarkable that he had a .393 obp. unlike Pepiton’s measly .284.

MikeD
MikeD
12 years ago
Reply to  Jimbo

Right. That’s just amazing. The Pepiton number is still crazy, but McGwire’s was done during a high-offensive period. It was a split season between the A’s and the Cardinals, but it was the A’s time that was off the charts. He hit 34 HRs, but only scored 48 times in 105 games. Had an OBP of .383, and added in another 24 doubles, but somehow only scored 12 times when he didn’t drive himself in. That had to be one bad offensive team. (I say this without looking it up.)

bstar
12 years ago

The most amazing thing about McGwire holding the all-time record here is how far ahead of second place he finished.

No other player had 60% of his runs scored due to his own HR. Next highest qualifying season is Matt Williams in ’94, the year he might have made a run at Roger Maris’ HR record. Williams hit 43 HR but scored only 74 runs that year (58.1%). Williams (483 PA) slipped through Doug’s qualifications (502 PA) because of the strike in ’94 but he did qualify for the batting title that year.

mosc
mosc
12 years ago

I am always more drawn to the big bonds years because Barry was on base at nearly a 50% clip and still rarely scored a run not off his own bat. I guess by total rate McGuire was worse. McGuire hit fewer singles. McGuire’s singles clip in 1997 was measurably closer to his HR rate than his walk rate. He, like bonds, in his 70HR season would have more HR than singles. Adam Dunn came close this year (50 singles and 41 HR) though so give him some love. Still, Dunn broke the 50% barrier in 2008 with 40 HR… Read more »

Richard Chester
Richard Chester
12 years ago
Reply to  mosc

Here are the top ten HR/H ratios.

Player …………Year,Ratio
Barry Bonds……2001,.468
Mark McGwire…..1998,.461
Mark McGwire…..1999,.448
Mark McGwire…..1996,.394
Mark McGwire…..1997,.392
Roger Maris……1961,.384
Adam Dunn………..2012,.373
Jose Bautista….2010,.365
Carlos Pena……..2009,.364
Matt Williams….1994,.361

mosc: Your numbers for Ruth are somewhat fouled up.

Richard Chester
Richard Chester
12 years ago

Most PA in a season with R = HR belongs to Aurelio Rodriguez who had 92 PA in 1983 with 1 HR and 1 R. Tied for second with 89 PA, 2 HR and 2 R are Smoky Burgess (1965) and Bob Nieman (1961).

Richard Chester
Richard Chester
12 years ago

As long as we seem to have a lull in comments see if you can solve this quiz. What seasonal feat has Edgar Martinez achieved that no one else has?

Richard Chester
Richard Chester
12 years ago
Reply to  Doug

That’s not it. There are 2 parameters involved.

John Autin
Editor
12 years ago

Only season with 140+ RBI and fewer than 10 games in the field?

Richard Chester
Richard Chester
12 years ago
Reply to  John Autin

That’s still not it.

bstar
12 years ago

I thought I had it, but Luis Gonzalez joins Edgar as the only two hitters to have more than 50 doubles and 163 hits or less.

bstar
12 years ago

How about 52 or more doubles and less than 500 AB, Richard?

Richard Chester
Richard Chester
12 years ago
Reply to  bstar

Still not right.

John Autin
Editor
12 years ago

In the years for which we have GIDP data, Edgar is the only player with one qualifying season with 2 GIDP or fewer, and another with 20 or more.

Probably not what Richard’s after, but it’s a hell of a freaky fact!

Richard Chester
Richard Chester
12 years ago
Reply to  John Autin

You are right, it’s not what I am after.

Richard Chester
Richard Chester
12 years ago

Interest in this quiz seems to have died out so I may as well reveal the answer. Since 1901 there have been 278 occurrences of a player accumulating 80 XBH in a season. Martinez is the only one to do it and have fewer than 300 TB. In 1996 he had 80 XBH and 297 TB.

Matthew Glidden
12 years ago

Led his league in doubles and runs but hit zero triples?

Richard Chester
Richard Chester
12 years ago

That may or may not be true but it is not what I am looking for.

Doug
Doug
12 years ago

That is true, Matthew.

Something else that’s true is that Edgar is the only player to slug .600 with an OPS > 1.000 and zero triples, while hitting fewer than 30 home runs.

Richard Chester
Richard Chester
12 years ago
Reply to  Doug

That is also not what I am looking for.

brp
brp
12 years ago

Soundtrack for this post/topic courtesy of Final Fight 3 for the SNES:
http://gh.ffshrine.org/soundtracks/3653

Heavy Hitters!