Strange trends in pitches per plate appearance

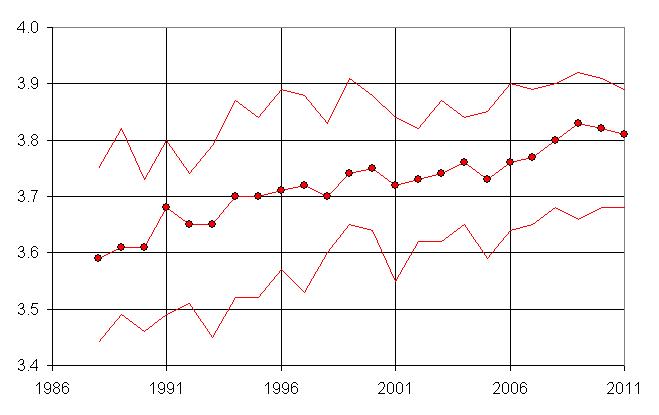
Here’s a plot showing the average pitches per plate appearance across all of MLB going back to 1988:

Click through for discussion.

Why 1988? That’s as far back as Baseball-Reference.com has complete pitch data.

The graph above shows the average number of pitches (the circles) as well as the average for the team with highest and lowest values for each season (the undotted lines).

What does this mean? Why does this happen? I don’t think  have definitive answers, but here is some food for thought:

  • There is a strong correlation between the number of pitches per plate appearance and the rate of batters striking out. The more pitches a batter sees, the more often he gets to a 2-strike count, and the more often he ultimately strikes out. Think of it this way–if a batter swung on both the first and second pitches of every at-bat, he’d rarely strike out because he’d put the ball in play a lot.
  • It’s possible that this is a sort of Moneyball effect, with patience in working the count becoming more prevalent across baseball. I tend to doubt this, though, as walks haven’t changed much over the last 20-some years.
  • Systematic changes in umpiring could be involved, although I don’t see how.

The one thing that does make sense to me is that pitches per plate appearance correlates with both the total innings pitched and total appearances by relievers. We know that from the late 1980s until the late 2010s, duration of starts got shorter and shorter, meaning that relievers pitched more, on average, in each game. We also know that specialists such as the LOOGY have become more and more prevalent. These trends have started to reverse a bit in the last few years.

I think it’s likely that starting pitchers are much more conscious of pitch counts than relievers. A starter knows that he won’t have the gas to pitch the 7th inning if he’s reached 100 pitches through 5 innings, and this may make him more likely to throw “out” pitches, such as those trying to induce a swing and a weak grounder, as opposed to trying to really work a batter and ultimately strike him out.

Relievers, on the other hand, have no such limitations. Again think of the LOOGY in the extreme case–this is a Lefty One Out GuY who knows he’s only going to face one batter. After he’s thrown maybe 30 warm-up pitches in the bullpen and a few more on the mound, what difference does it make to him if he throws 2, 3, 5, or 7 pitches to the batter? He might as well be as crafty as possible, and if that means nibbling and throwing lots of pitches, so be it.

This effect is minor, but these days it might be multiplied for 3or 4 relievers who are pitching a total of 3 innings, whereas in 1988 it might have been 2 relievers pitching a total of 2 innings. That’s a lot of batters over the course of a season, so even a small effect can show up as a 5% difference over an entire year.

0 0 votes
Article Rating
Subscribe
Notify of
guest

22 Comments
Oldest
Newest Most Voted
Inline Feedbacks
View all comments
Dr. Doom
Dr. Doom
12 years ago

This isn’t really surprising at all. K rates are higher, and those require, by definition, at least 3 pitches. There are 10 PA/G which result in either a walk or strikeout. That’s an all-time high (actually, 2010 was the high – 10.4 – from what I can tell). That’s definitely going to cause an uptick in pitches. Additionally, I’ve read Tango mentioning this a number of times: starter, throughout most of baseball history, have thrown about 100 pitches per game. Sure, the deviation used to be wider longer ago (anywhere from 60-140 pitches, rather than the 90-110 we see now),… Read more »

Andy
12 years ago
Reply to  Dr. Doom

Your first paragraph isn’t really cause-effect though. Batters strike out more and that’s why there are more pitches per plate appearance? They both seem to be effects, to me–what is the CAUSE?

Dr. Doom
Dr. Doom
12 years ago
Reply to  Andy

I guess I didn’t really mean it in a cause-effect way. I meant it more in the way that, based on the stats and trends of which I was aware, this piece of information makes a lot of sense. As to an underlying cause? I have no idea.

kzuke
kzuke
12 years ago

I’d be interested in seeing the trends in number of pitches/PA by inning over the last 25 years. I bet we’d see a pretty significant increase in innnings 7-9 over that period.

Dr. Remulak
Dr. Remulak
12 years ago

And the gap between the highest and lowest team each year has tightened since 15+ years ago. This could indeed reflect the spread of the Moneyball philosophy of value in seeing alot of pitches and working the count.

Doug
Doug
12 years ago

Would be interesting also to see correlation to game time duration. I except game time will have increased by more than 5% because of the effect of more pitchers (mound visits, warmups), as well as more pitches.

Bells
Bells
12 years ago
Reply to  Doug

Yeah, first thought that came into my head as well.

John Autin
Editor
12 years ago

Another factor suggested by the graph but not mentioned yet is HR rates.

When HR rates are higher, pitchers tend to be more careful.

The long upward trend of the main graph begins in 1993-94, shortly after the start of what we now call the PED Era, and ends in 2009, shortly after that era’s end. (Or perhaps I should say, “end.”)

birtelcom
birtelcom
12 years ago
Reply to  John Autin

That sounds right to me, John. Historical hypothesis: Over baseball history, gloves got bigger, playing fields became better cared for and thus easier to field on and fielders became faster afoot. This made getting on base via balls in play tougher. Hitters adjusted by swinging more for the fences, including adopting lighter, whippier bats that are harder to control with respect to making contact but result in more homers when contact is made. Essentially, batters accepted more swinging strikes (i.e., less frequent contact) in return for more homers, an adjusted tradeoff that makes sense if fielding errors decline and the… Read more »

Lawrence Azrin
Lawrence Azrin
12 years ago
Reply to  birtelcom

birtelcom,

With scoring going down significantly the last several years, might this mean that starters go somewhat DEEPER into games, and relievers are used a little less frequently? Is the trend towards more relievers used per game inexorable enough, to overcome lower offensive levels?

John Autin
Editor
12 years ago
Reply to  Lawrence Azrin

I think the answer to both questions is yes.

Starters may go slightly deeper, but managers may keep subdividing the remainder among more and more relievers.

Average start in 2000 was 5.92 IP.
Average start in 2011 was 6.03 IP.

Average relief appearance in 2000 was 1.17 IP.
Average relief appearance in 2011 was 1.02 IP.

In 2000, there were 140 pitchers with at least 40 games in relief.
In 2011, there were 163.

birtelcom
birtelcom
12 years ago
Reply to  Lawrence Azrin

My guess is that if the scoring decline is accompanied by a decline in pitches thrown and a decline in the length of games then we probably will see the beginning of a trend toward longer outings from starters. A good starter on his 95th pitch (or his 120th minute into the game) may be a better choice than a team’s middle relievers, whereas that same starter on his 105th pitch (or his 135th minute into the game) may not be. Note that declines in scoring are not necessarily accompanied by a decline in pitch count or game times, if… Read more »

John Autin
Editor
12 years ago
Reply to  Lawrence Azrin

Average per game for all MLB:
Number of Relievers Used, Outs per Appearance, and Total Relief Outs per Game:
2011 — 2.86 … 3.07 … 8.79
2000 — 2.54 … 3.52 … 8.95
1990 — 2.02 … 4.26 … 8.58
1980 — 1.56 … 5.11 … 7.99
1970 — 1.66 … 4.64 … 7.72

kds
kds
12 years ago

Can we look up pitches/PA separately for starters and relievers? Andy’s theory should show relievers higher than starters.

John Autin
Editor
12 years ago
Reply to  kds

kds — I can’t find a way to get that data straight from B-R, but with a little Excel work I figured that relievers in 2011 averaged 3.89 Pit/PA. And since the overall average was 3.81, and SPs accounted for about 2/3 of all IP, algebra says that SPs averaged about 3.77 Pit/PA. (Since I was using season data for individual pitchers, I set the threshold for being counted as “reliever” at relieving in 80% of his total games.) I’m not sure if that gives you enough for what you wanted … I kind of lost sight of the point,… Read more »

Mark in Sydney
Mark in Sydney
12 years ago

It is a shame that we don’t have ball-by-ball for the early days. I suspect that there are all sorts of subtle changes going on here, coming together to create this effect. I had the thought that this change may be similar to the dead-ball/live-ball change. It was an era dominated in the first half by pitchers, then by bats. Looking at one extra-ordinary pitcher who crossed the boundary, one W. Johnson. It was interesting to look at his BF/IP and completion rates (starts that became complete games) over his career: Dead Live BF/IP 3.85 4.21 Comp Rate 0.884 0.633… Read more »

MikeD
MikeD
12 years ago

There may not be one single cause, but multiple factors. More offense/HRs causes pitchers to be careful (noted by John A above), changing their pitching patterns. Perhaps a slight narrowing of the strikezone by umpires.

Is there a difference between leagues? Wondering if the DH impacts the average.

Timmy Pea
Timmy Pea
12 years ago
Reply to  MikeD

I like the idea that pitchers are possibly adjusting to hitters not protecting the plate like they used to.

Tristram12
Tristram12
12 years ago

I believe this has more to do with the Moneyball effect than you might think, but based on the changing perceived cost of strikeouts instead of the changing perceived value of walks. One of the earlier Bill James learnings was that a strikeout isn’t a worse out than other outs. No, you don’t advance runners, but you also avoid double plays. As the stigma of striking out has evaporated, batters are not swinging at borderline pitches to protect a possible called strike because they are not afraid of striking out. I would be interested in seeing swing rates by pitch… Read more »

Phil Gaskill
Phil Gaskill
12 years ago

I don’t get the part about “if a batter swung on both the first and second pitches of every at-bat, he’d rarely strike out.” If nothing else, the fact that there *is* a second pitch means he didn’t get a hit on the first pitch, meaning he *always* goes into the second pitch down 0-1. Then, if he should happen to fail to hit the *second* pitch for a hit, a foul, an error, or an out, necessitating a *third* pitch, he *always* goes into the third pitch 0-2. I don’t see how always going into the third pitch of… Read more »