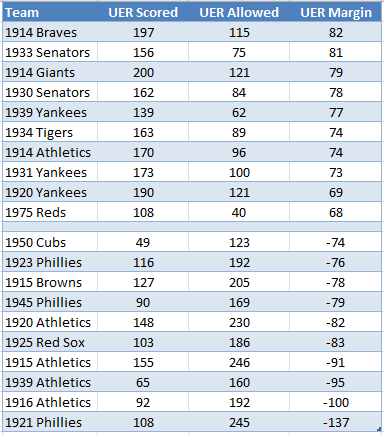
As football season gets underway, here’s a look at baseball’s version of the takeaway/giveaway margin. On the gridiron, the unit of measurement is turnovers and winning teams usually need to show a positive margin between turnovers forced (takeaways) and turnovers surrendered (giveaways). In baseball, the metric is more like points off of turnovers, as this post will consider unearned runs scored vs. unearned runs allowed, those runs being the “points” arising from errors forced and errors committed, More after the jump.
Here are this year’s leaders (through Aug 31) in Takeaway/Giveaway margin, that is unearned runs scored minus unearned runs allowed.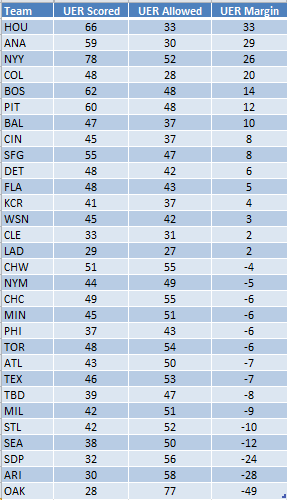
The Astros lead the way with the second best UER Scored and fourth best UER Allowed. The Dodgers, the other runaway league leader, have done things a bit differently with the second lowest UER Scored, but also (and more importantly) the lowest UER Allowed, an approach also favored by last year’s AL champion Indians, the only other team to score and allow fewer than 40 unearned runs. The Yankees are the runaway leaders in UER Scored but rank only third in UER Margin, owing to a UER Allowed total ranking near the bottom of the pack.
Surprises for me in this table include: the Orioles, with indifferent pitching but a lowish UER Allowed total; the Dodgers with so few unearned runs scored; and the D-Backs, challenging for a wildcard berth with the second worst UER Margin.
To provide some historical perspective here are the range of team UER Margin totals by season since 1913.
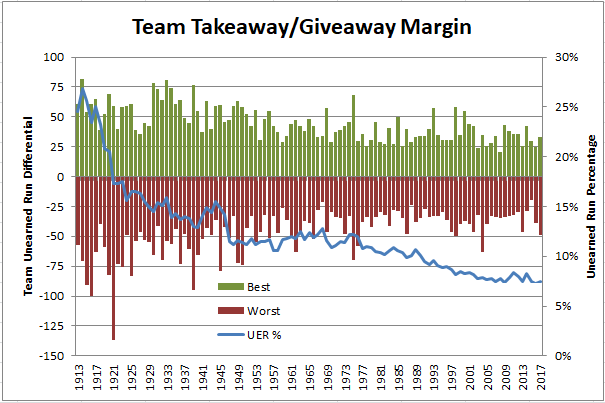
Today’s margins, both positive and negative, are nothing like what was seen 50 to 100 years ago. The reason, of course, is the decline in unearned runs as a proportion of total runs (blue line), a trend reflecting better athletes, better equipment and, in recent years, better technology that has been used to position players on the diamond for (hopefully) optimal defensive utility.
After about 30 years with little change in unearned run rates, these started to decline in the last half of the 1970s for the reasons alluded to, but also due to the increase in strikeout rates that continues, seemingly unabated, to this day. More strikeouts means fewer balls in play and fewer chances to commit errors that lead to unearned runs.
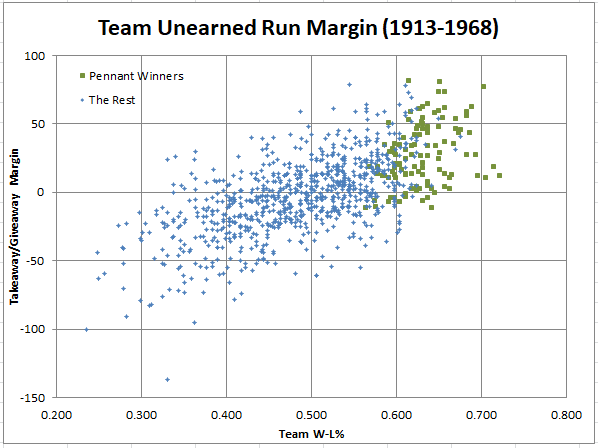
As would be expected, pennant winners have generally done well in takeaway/giveaway margin, especially in the years preceding divisional play, as shown below.
Almost every pennant winner recorded a positive or minimally negative takeaway/giveaway margin, and a number above +50 almost guaranteed a World Series berth. There are somewhat more teams that have a negative takeaway/giveaway margin compared to those with a positive total, reflecting the imbalance through most of this period of a few dominant teams but many more mediocre ones.
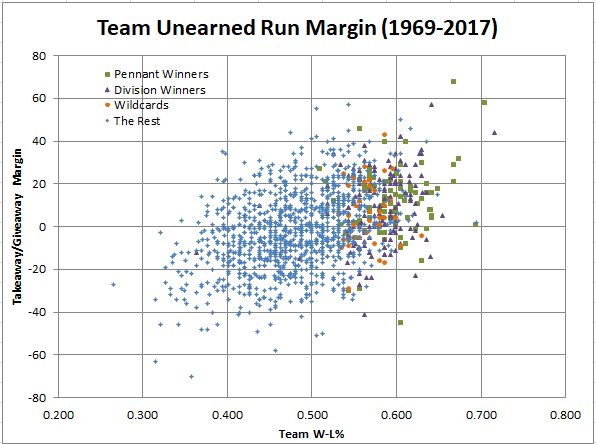
Since the inception of divisional play and a longer road to a pennant title, the chart looks a bit different (the post-season qualifiers are shown either as a pennant winner or by their regular season finish, but not both).
Some notes on the chart above.
- As was suggested by the first chart. the magnitude of the takeaway/giveaway margin has declined appreciably from the preceding period, reflecting a lower proportion of total runs that are unearned.
- As with the preceding period, pennant winners usually post a positive takeaway/giveaway margin but, with the declining magnitude of the margin (and, therefore, its significance), more teams reach the post-season with a negative margin.
- There is less skewing of the data to negative margins, likely reflecting more performance parity among teams in the divisional era.
The question that remains, though, is whether a good takeaway/giveaway margin is a cause or an effect of championship-caliber teams. To answer that question, I looked at the takeaway/giveaway percentage margin
being the difference between the percentage of runs scored that are unearned and the percentage of runs allowed that are unearned.
This approach looks at scoring and allowing unearned runs in each team’s own offensive and defensive context so that a positive result indicates a team that had a higher proportion of runs scored that are unearned than runs allowed, regardless of whether the absolute margin was positive. Similarly, a negative margin reflects a higher proportion of unearned runs allowed than unearned runs scored, regardless of whether the absolute margin is negative. Thus, if achieving a good takeaway/giveaway margin leads to team success, the same pattern observed for absolute takeaway/giveaway margin by successful teams should also hold for the percentage margin.
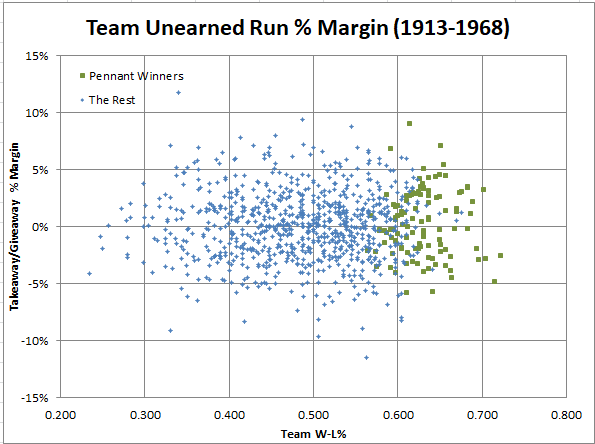
But, does it? Plotting team results for the same two periods as above shows this result.
No discernible pattern here with pennant winners mixed in more or less randomly with the rest of the teams, for both typical ( +/- 5%) and extreme results.
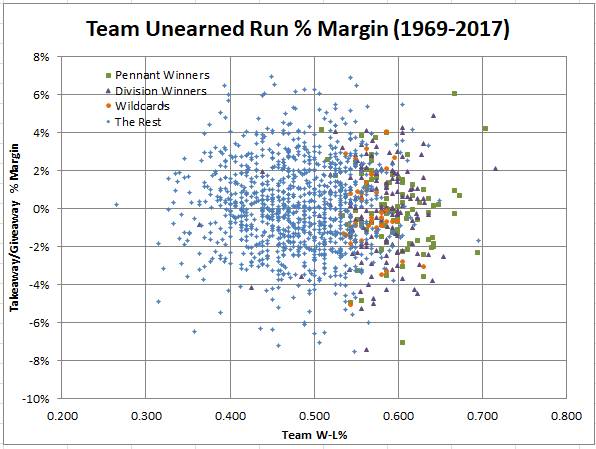
Similar story for the divisional era.
The one noteworthy aspect of this illustration is that the increase in playoff teams starting in 1995 has, probably unsurprisingly, produced a greater variance in this metric, with slightly more playoff teams in negative territory than positive. Teams with good offense and good pitching, but average or worse defense, can certainly make the post-season but will be hard-pressed to record a positive number in the percentage metric owing to allowed unearned runs representing a relatively large proportion of a smaller number of total runs allowed.
The results shown in the last two charts are suggestive of takeaway/giveaway margin being an effect of being a good team rather than a cause. That is, good teams are not good because they have a good takeaway/giveaway margin. Rather, good teams are likely to have a good takeaway/giveaway margin because they are good teams (much as can be said about good football teams).
For those who would like to take a closer look at the data, you can find it here. Note that in B-R’s P-I Split Finder results (the source of these data) a franchise’s current city abbreviation is used for all of the franchise’s seasons. This can lead to some surprising data like OAK 1917, for example, which, of course, is really PHA 1917.

