On Wednesday’s NLCS game, Tom Verducci remarked on this factoid.
| Rk | Tm | Year | Games | W | L | PA | AB | R | H | 2B | 3B | HR | RBI | BB | SO | SB | CS | |||||
|---|---|---|---|---|---|---|---|---|---|---|---|---|---|---|---|---|---|---|---|---|---|---|
| 1 | SFG | 2014 | 5 | 4 | 1 | Ind. Games | 189 | 169 | 15 | 41 | 5 | 1 | 0 | 12 | 13 | 18 | .243 | .301 | .284 | .585 | 2 | 2 |
Above is a list by team of the number of 2014 post-season games with 4 or fewer batting strikeouts. So, where is the rest of the list, you ask? Actually, that is the whole list. The Giants have had no more than 4 batting strikeouts in 5 of their 10 post-season games. The other 9 playoff teams – nada.
Verducci has expressed how impressed he is by the Giants’ ability to score without the need of a base hit, a knack he attributes to their low strikeout total. The rationale is that fewer strikeouts mean more balls in play, more pressure on the defense and, therefore, more runs scored. Is he right? Let’s find out.
Before we leave the Giants’ exploits, consider that they have averaged 3 runs in the 5 games above, four of them wins. This despite no home runs and a paltry .585 OPS. Obviously a very small sample size, but considerably better than this season’s 651 NL team games against NL opponents with no home runs and team OBP and SLG both under 0.350. The median runs scored in those games was only 1 with median strikeouts of 8, resulting in a 162-489 record for a 0.249 winning percentage (in other words, the 1962 Mets).
The prevailing trends in the majors are, of course, declining run production and ever increasing strikeouts. Thus, it would be reasonable to suppose that more strikeouts would, in fact, lead to less scoring. But, are the strikeouts a cause and are runs scored an effect? Or, are higher strikeouts and lower scoring both merely symptoms of increasing pitcher dominance?
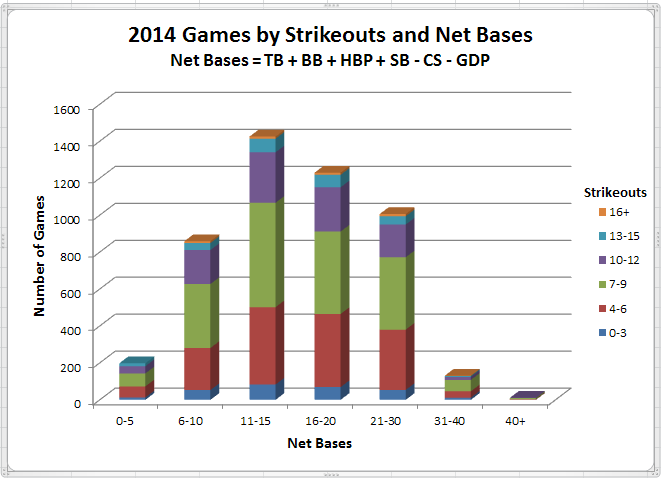
To find out, I looked at all 2340 major league games in 2014 using data provided by Baseball-Reference.com. To encapsulate offense in each game, I calculated Net Bases as TB + BB + HBP + SB – CS – GDP. In other words, bases gained by batters plus net stolen bases (missing, of course, are bases gained or lost due to baserunning prowess). That metric looks like this:
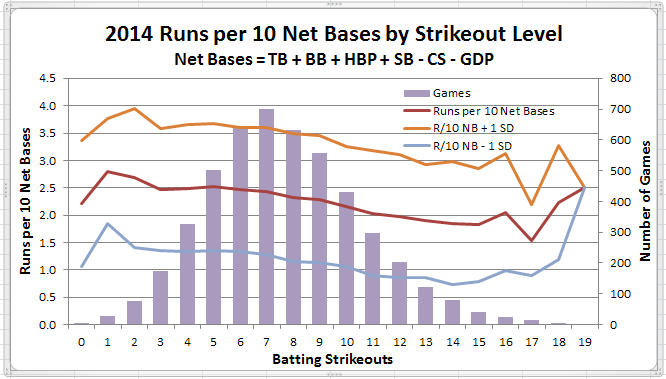
Those are the 2340 games of the 2014 season (or, rather, the 4680 team games) broken down by Strikeouts and Net Bases. Most games (about 82%) have between 4 and 12 team strikeouts and between 6 and 30 net bases. To look at the range of runs scored for the same strikeout levels, a metric of Runs per Net Base is derived. To make it more meaningful, I’ve called that Runs per 10 Net Bases. That result is shown below.

The center line is the average Runs per 10 Net Bases in all games with the indicated number of batting strikeouts (the columns show how many of those team games there were). The companion lines are +/- one standard deviation. While the standard deviation is substantial (i.e. there can be a wide range of runs scored from the same number of net bases), there is nevertheless a clear and consistent trend to declining scoring with increased strikeouts. A better illustration may be the chart below.
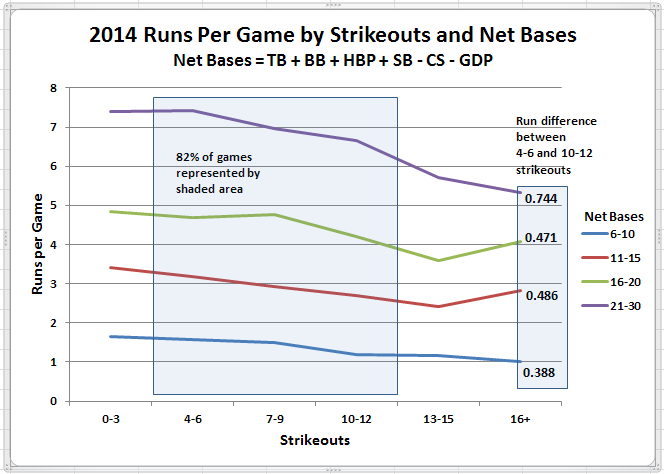
Above are the average runs per game for the subset of games with the indicated Strikeout and Net Base levels. The highlighted numbers on the right side of the chart show how many runs per game are lost at each Net Base level between the 4-6 Strikeout level and the 10-12 Strikeout level. Those are significant reductions and a clear indication that a team will do much better if it can reduce its strikeouts while maintaining the same Net Base level. But, can teams do that?
While there are runs to be gained by reducing strikeouts, there is a much greater increase in runs that will result from increasing Net Bases. So, if a team reduces its strikeouts at the expense of its Net Bases, that result will likely be to a team’s detriment. Hence, the argument for striking out a lot – yes, it reduces balls in play (a lot) but that’s the price to be paid if you want more extra-base hits and, especially, more home runs.
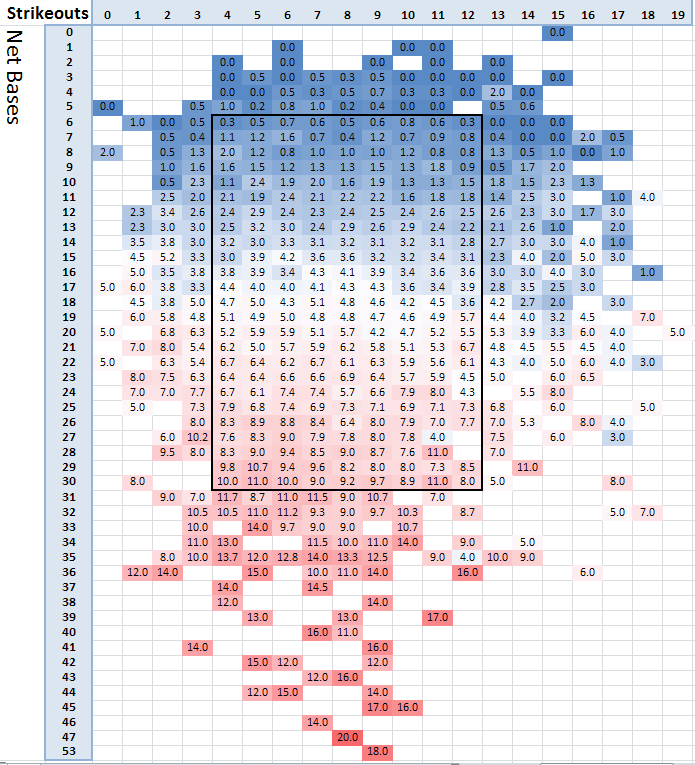
The much stronger correlation between Net Bases and scoring than between Strikeouts and scoring can be gleaned from the table below.
Above are the average runs scored in 2014 games for each combination of Net Bases and strikeouts (the averages are subject to small sample distortion as some cells will represent small numbers of games). The bordered area is where 82% of games occurred. The relation between strikeouts and scoring is most pronounced in the corners of this area, showing the highest (red) and lowest (blue) scoring games. Looking at the center of the bordered area, though, will show only modest changes in run scoring scanning along a row (especially below 10 strikeouts), but much more significant changes scanning along a column (especially below 20 net bases).
So, what have we learned? I would summarize as follows:
- increased scoring can result from fewer strikeouts provided that offensive output (as represented by Net Bases) does not suffer as a result
- therefore, let your sluggers slug and accept the strikeouts that result – they’re likely worth it (up to a point)
- but, get your would-be sluggers who aren’t to focus on making more contact
Who falls into the category for point 3? Well, these guys for starters. They had ISO of 0.100 or less in 2014 despite striking out in more than 15% of their 400+ PAs.
| Rk | Player | SO | PA | Year | Age | Tm | G | AB | R | H | 2B | 3B | HR | RBI | BB | |||||
|---|---|---|---|---|---|---|---|---|---|---|---|---|---|---|---|---|---|---|---|---|
| 1 | Chris Johnson | 159 | .098 | 611 | 2014 | 29 | ATL | 153 | 582 | 43 | 153 | 27 | 0 | 10 | 58 | 23 | .263 | .292 | .361 | .653 |
| 2 | Austin Jackson | 144 | .090 | 656 | 2014 | 27 | TOT | 154 | 597 | 71 | 153 | 30 | 6 | 4 | 47 | 47 | .256 | .308 | .347 | .655 |
| 3 | Jackie Bradley | 121 | .068 | 423 | 2014 | 24 | BOS | 127 | 384 | 45 | 76 | 19 | 2 | 1 | 30 | 31 | .198 | .265 | .266 | .531 |
| 4 | Leonys Martin | 114 | .090 | 583 | 2014 | 26 | TEX | 155 | 533 | 68 | 146 | 13 | 7 | 7 | 40 | 39 | .274 | .325 | .364 | .689 |
| 5 | Allen Craig | 113 | .100 | 505 | 2014 | 29 | TOT | 126 | 461 | 41 | 99 | 20 | 1 | 8 | 46 | 35 | .215 | .279 | .315 | .594 |
| 6 | Dee Gordon | 107 | .089 | 650 | 2014 | 26 | LAD | 148 | 609 | 92 | 176 | 24 | 12 | 2 | 34 | 31 | .289 | .326 | .378 | .704 |
| 7 | Robbie Grossman | 105 | .100 | 422 | 2014 | 24 | HOU | 103 | 360 | 42 | 84 | 14 | 2 | 6 | 37 | 55 | .233 | .337 | .333 | .670 |
| 8 | Jason Kipnis | 100 | .090 | 555 | 2014 | 27 | CLE | 129 | 500 | 61 | 120 | 25 | 1 | 6 | 41 | 50 | .240 | .310 | .330 | .640 |
| 9 | Brock Holt | 98 | .100 | 492 | 2014 | 26 | BOS | 106 | 449 | 68 | 126 | 23 | 5 | 4 | 29 | 33 | .281 | .331 | .381 | .711 |
| 10 | DJ LeMahieu | 97 | .081 | 538 | 2014 | 25 | COL | 149 | 494 | 59 | 132 | 15 | 5 | 5 | 42 | 33 | .267 | .315 | .348 | .663 |
| 11 | Joe Mauer | 96 | .095 | 518 | 2014 | 31 | MIN | 120 | 455 | 60 | 126 | 27 | 2 | 4 | 55 | 60 | .277 | .361 | .371 | .732 |
| 12 | Emilio Bonifacio | 85 | .086 | 426 | 2014 | 29 | TOT | 110 | 394 | 47 | 102 | 17 | 4 | 3 | 24 | 26 | .259 | .305 | .345 | .650 |
| 13 | Daniel Nava | 81 | .091 | 408 | 2014 | 31 | BOS | 113 | 363 | 41 | 98 | 21 | 0 | 4 | 37 | 33 | .270 | .346 | .361 | .706 |
| 14 | Jon Jay | 78 | .075 | 468 | 2014 | 29 | STL | 140 | 413 | 52 | 125 | 16 | 3 | 3 | 46 | 28 | .303 | .372 | .378 | .750 |
| 15 | Ruben Tejada | 73 | .073 | 419 | 2014 | 24 | NYM | 119 | 355 | 30 | 84 | 11 | 0 | 5 | 34 | 50 | .237 | .342 | .310 | .652 |


