“Good young pitching” was a dominant theme of the 2013 MLB season, as discussed by fans and media. Ever skeptical of perceived trends, I had to ask: Were the numbers truly unusual, or was the discussion based on selective notice? And if the numbers do stand up to initial scrutiny, are they part of a trend, or just a random event? Here’s a quick study of pitchers and age since 1998, the last expansion year.
I went at this two ways. First, I just counted the pitchers meeting certain thresholds of age, innings and WAR output. I’ll show two of those graphs, both suggesting that this year was unusual. Yet this method alone does not indicate a trend. The second method is broader and, I think, much more revealing.
Young standouts
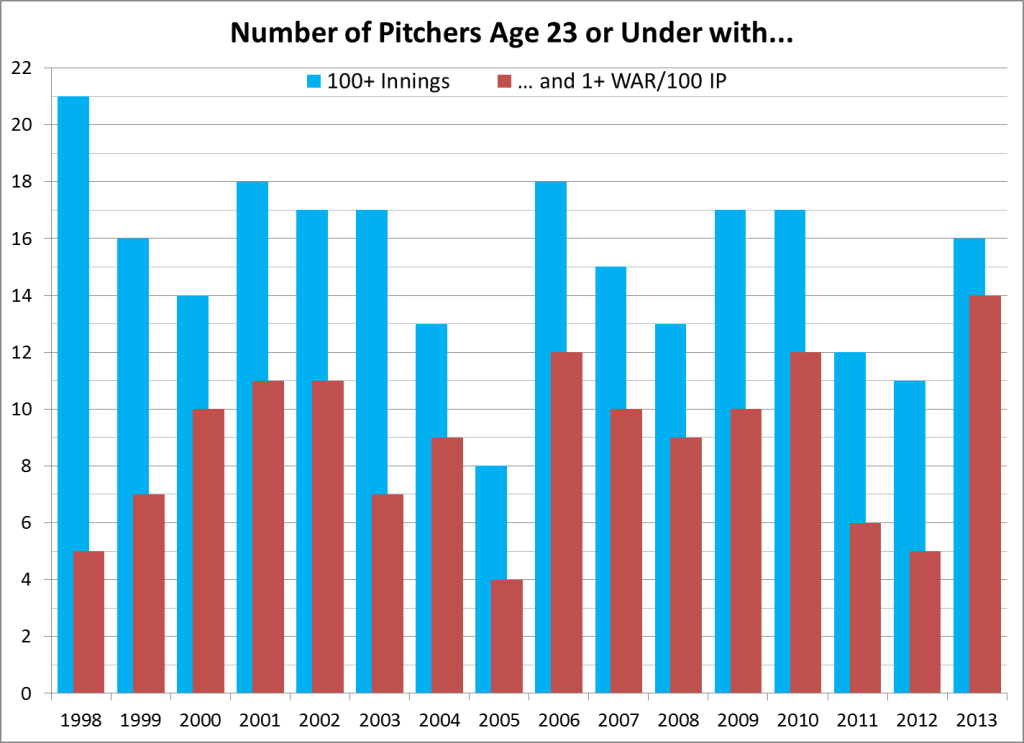
Our first graph covers pitchers age 23 or under as of June 30, a simple count of two groups:
- those with at least 100 innings that season, and
- those with 100+ IP and at least 1.0 WAR per 100 IP.
Granted, all such thresholds are arbitrary, and this first pool excludes such 2013 stars as Chris Sale, Matt Harvey and Stephen Strasburg (all age 24), along with postseason stars Michael Wacha and Trevor Rosenthal (young enough, but short of 100 IP). But this is just one quick look:
The tally of those with 100 innings (the blue bars) was not unusual: 16 pitchers age 23 or under reached 100 IP in 2013, which is just a bit above average for the period (15.2).
But the WAR-based count (red bars) is extreme, indeed: 14 pitchers age 23 or under had both 100 IP and 1.0 WAR/100 IP. That’s five more than the period average (8.9), and two more than any other year in the period.
(Here are the names for 1998-2013 meeting both criteria, and the detail for 2013. We can’t help but notice that all but one of this year’s group were NLers, and four were Miami Marlins. But let’s stick to the big picture.)
For all ages this year, 79 pitchers met both criteria, so the 14 youngsters comprised 18% of that total. That, too, is the high for the period, whose average is 12%.
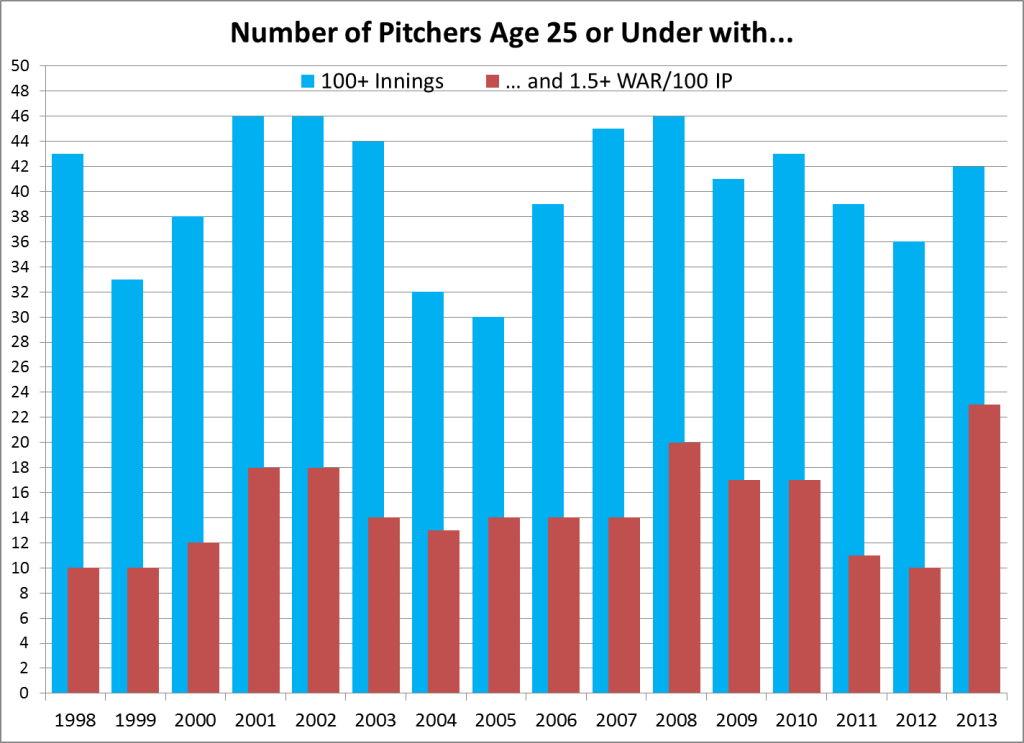
The next graph varies the theme, raising the cutoffs to age 25 or under and at least 1.5 WAR per 100 IP. This season had 23 such pitchers, three more than any other year in the period, which averaged 14.7. (In fact, 2013 had the most pitchers ever meeting both criteria, but that comes with a grain of salt: there are simply far more pitchers in the current era than for most of MLB history.)
(Again, here are the names for 1998-2013, and the detail for 2013.)
This year’s 25-and-unders comprised 43% of all pitchers meeting the IP and WAR criteria, also the high for the period, which averaged 30%.
But while both graphs peak in 2013, neither one shows a clear trend, either for innings alone or for innings-plus-WAR. In both cases, the WAR-based counts for 2012 and 2011 were below the period average. Running more graphs with various cutoffs might bring out a trend … or not. But from what we see here, it’s too soon to say if this year’s numbers are anything but cyclical variation.
Average age
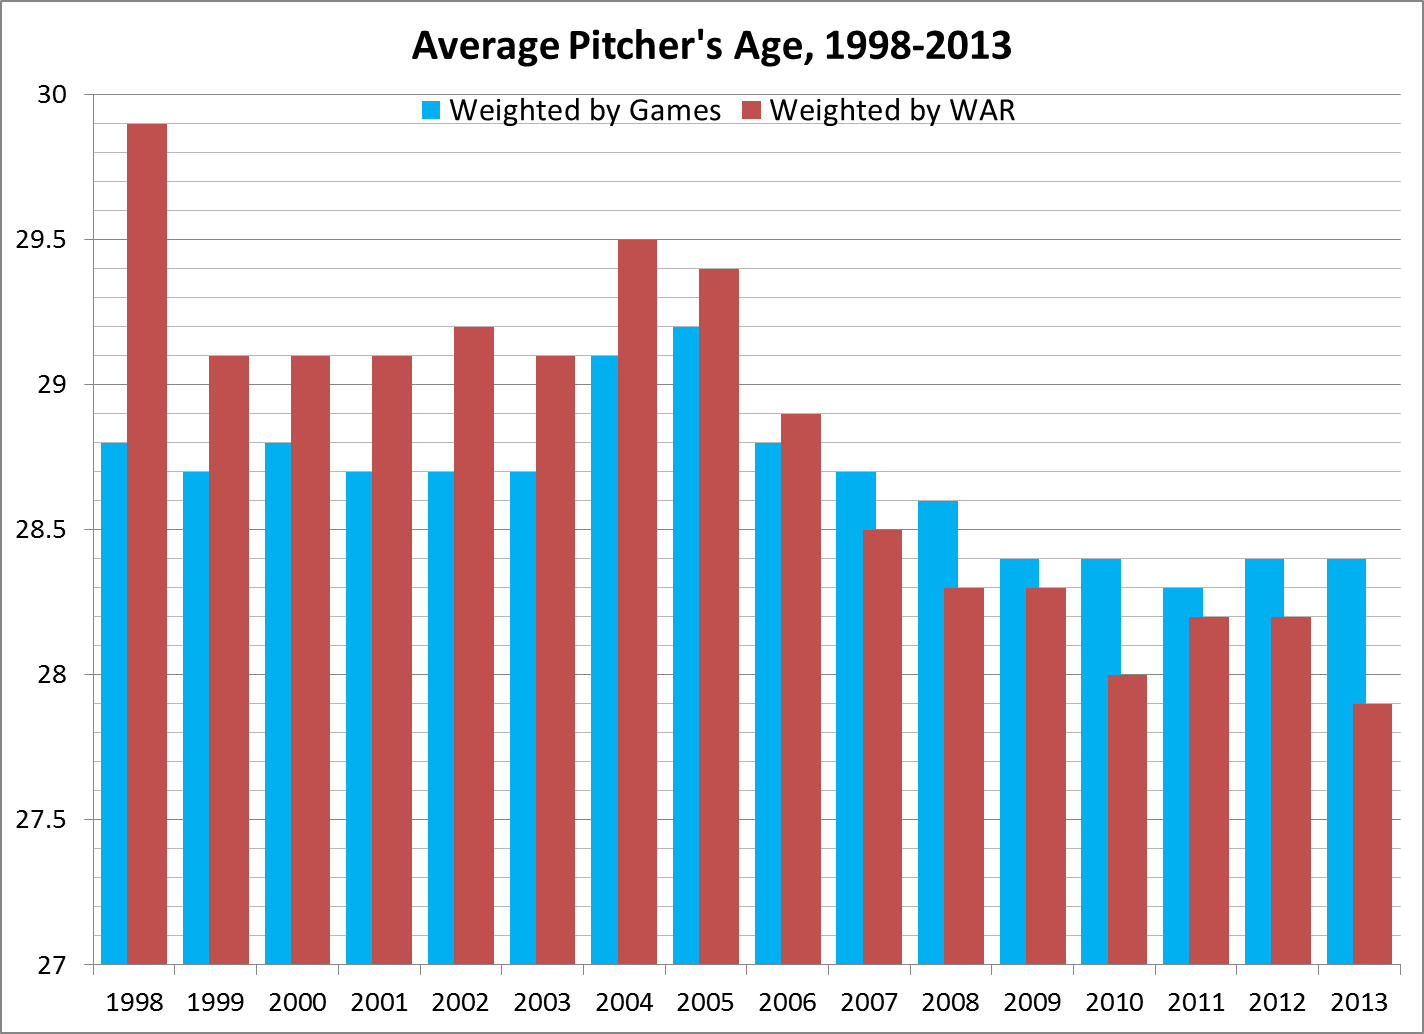
What if we move past arbitrary standards to a broader measure of pitchers’ ages? I graphed the average age figure given by Baseball-Reference (“PitchAge”), which is weighted by games — more precisely, weighted by [3*GS + G + Sv]. I’ll call this figure Games age. That graph was suggestive, but hardly conclusive; the range for 1998-2013 is less than one full year, and this season’s 28.4 is just a bit under the period average of 28.7.
Seeking to gauge not just how much they pitched, but how well, I calculated WAR-weighted averages, by:
- multiplying each pitcher’s age by his WAR;
- totaling those figures; and
- dividing that by the total of pitchers’ ages.
I’ll call this figure WAR age. The last graph shows both of those figures, with Games age in blue, WAR age in red:
Now, that looks like a trend, no? In the latter half of this period, both age measures have been falling pretty steadily, but especially the WAR age. That measure in 1998-2005 was over 29 each year, averaging 29.3. Since 2006, WAR age has been under 29 each year, averaging 28.3. And the 27.9 WAR age for 2013 is the lowest for the period studied.
The range of WAR age for 1998-2013 was from 27.9 to 29.9, with an average of 28.8. The high WAR age for 1998 might be an effect of expansion, bringing in more young pitchers who weren’t very good. But expansion effects tend to be smaller and briefer than is widely believed, and the ’98 expansion, from 28 to 30 teams, added just 7% to the total rosters. Anyway, that spike is gone by 1999; the WAR age holds between 29.1-29.5 through 2005, then starts a steady decline.
I would not assume that a rise of young pitchers is the whole cause of declining WAR age. Recent years have seen fewer star turns by older pitchers. A count of 4-WAR seasons by pitchers age 36 and up shows 31 such seasons in the first half of this period (five each by Randy Johnson and Roger Clemens), but just 11 such seasons in 2006-13. Some of you may have theories for this decline, but I’ll leave it alone.
Lastly, I spot-checked the WAR age for a few seasons outside the period, in four pairs:
- 1972-73, bridging the DH, with Bert Blyleven and Jon Matlack pacing the 25-and-unders for that span;
- 1978-79, with Dennis Eckersley way ahead of the pack;
- 1985-86, led by Dwight Gooden and Roger Clemens; and
- 1992-93, bridging the previous expansion, with Kevin Appier dominating the age group.
None of those eight seasons had a lower WAR age than this year’s 27.9, but 1972-73 and ’78 all hit that same mark. The other five years were between 28.0 and 28.4.
Viewed together, these data tend to suggest that the high WAR age for 1998-2005 (averaging 29.3) was aberrant, at least for the divisional era. The current trend could be just a return to historical norms, or it might be something new altogether. But it does seem to be real — and, in some cases, spectacular.
Your thoughts?


