
August’s AL Pitcher of the Month was the Blue Jays’ Bowden Francis. If you’ve never heard of him, you’re not alone. Despite that lack of notoriety, Francis, whose career totals prior to August included just 81⅓ IP and four starts, has turned in two of the more remarkable months of pitching of the modern era. More after the jump.
Francis’s season hardly began like one in which he was likely to be named Pitcher of the Month. Prior to this season Francis had pitched only 37 innings, all in relief, yet found himself in the starting rotation as the season began. That experiment was short and painful, with Francis demoted to the pen after two horrific outings, and then back to the minors before April was done. He returned to the Blue Jays in June and made 11 appearances, 10 in relief, with a 4.13 ERA, hardly suggesting what was to happen next.
When Toronto dealt Yusei Kikuchi to the Astros at the trade deadline, Francis returned to the rotation. Beginning with his second start in August, Francis ran off this string of 7 starts.
| Rk | Gcar | Gtm | Date | Tm | Opp | Rslt | Inngs | Dec | DR | IP | H | R | ER | BB | SO | HR | HBP | BF | Pit | Str | StL | StS | GB | FB | LD | PU | Unk | GSc | SB | CS | 2B | 3B | GDP | SF | ROE | WPA | RE24 | Entered | Exited | |
|---|---|---|---|---|---|---|---|---|---|---|---|---|---|---|---|---|---|---|---|---|---|---|---|---|---|---|---|---|---|---|---|---|---|---|---|---|---|---|---|---|
| 20 | 41 | 120 | Aug 12 | TOR | @ | LAA | W,4-2 | GS-7 | W(5-3) | 4 | 7.0 | 1 | 1 | 1 | 0 | 8 | 1 | 0 | 22 | 81 | 57 | 16 | 9 | 6 | 8 | 0 | 1 | 0 | 79 | 0 | 0 | 0 | 0 | 0 | 0 | 0 | 0.290 | 2.52 | 1b start tie | 7b 3 out a3 |
| 21 | 42 | 125 | Aug 18 | TOR | @ | CHC | W,1-0 | GS-7 | W(6-3) | 5 | 7.0 | 3 | 0 | 0 | 0 | 7 | 0 | 0 | 25 | 95 | 71 | 16 | 13 | 8 | 10 | 1 | 3 | 0 | 78 | 0 | 0 | 1 | 0 | 0 | 0 | 0 | 0.497 | 3.49 | 1b start tie | 7b 3 out a1 |
| 22 | 43 | 131 | Aug 24 | TOR | LAA | W,3-1 | GS-9 | W(7-3) | 5 | 8.0 | 1 | 1 | 1 | 3 | 12 | 1 | 1 | 28 | 117 | 84 | 20 | 15 | 4 | 8 | 1 | 1 | 0 | 85 | 0 | 0 | 0 | 0 | 1 | 0 | 0 | 0.426 | 2.87 | 1t start tie | 9t — 0 out a2 | |
| 23 | 44 | 136 | Aug 29 | TOR | @ | BOS | W,2-0 | GS-7 | W(8-3) | 4 | 7.0 | 1 | 0 | 0 | 0 | 5 | 0 | 0 | 22 | 70 | 51 | 15 | 6 | 3 | 14 | 3 | 4 | 0 | 80 | 0 | 1 | 0 | 0 | 0 | 0 | 1 | 0.462 | 3.63 | 1b start tie | 7b 3 out a2 |
| 24 | 45 | 141 | Sep 4 | TOR | PHI | L,2-4 | GS-6 | L(8-4) | 5 | 6.0 | 6 | 3 | 3 | 0 | 6 | 2 | 1 | 24 | 89 | 61 | 11 | 14 | 10 | 7 | 1 | 1 | 0 | 54 | 0 | 0 | 0 | 0 | 1 | 0 | 0 | -0.030 | -0.11 | 1t start tie | 6t 3 out d1 | |
| 25 | 46 | 147 | Sep 11 | TOR | NYM | L,2-6 | GS-9 | 6 | 8.0 | 1 | 1 | 1 | 1 | 1 | 1 | 2 | 28 | 111 | 68 | 11 | 9 | 5 | 19 | 5 | 6 | 0 | 76 | 0 | 0 | 0 | 0 | 0 | 0 | 0 | 0.228 | 2.85 | 1t start tie | 9t — 0 out tie | ||
| 26 | 47 | 152 | Sep 18 | TOR | @ | TEX | L,0-2 | GS-6 | L(8-5) | 6 | 6.0 | 5 | 2 | 2 | 1 | 6 | 1 | 1 | 25 | 100 | 65 | 18 | 9 | 3 | 14 | 7 | 0 | 0 | 59 | 0 | 0 | 1 | 0 | 0 | 0 | 0 | 0.021 | 0.85 | 1b start tie | 6b 3 out d2 |
The totals are 49 IP with a 1.47 ERA, allowing only 18 hits and 5 walks, and holding hitters to a .110 BA and .161 OBP. Included were two games in which Francis took a no-hitter into the 9th inning. So you may be thinking “Okay, he was on a hot streak, but lots of pitchers have hot streaks, so what’s the big deal?” to which the response is that Francis’s hot streak is historically good, among the top 10 of the modern era for fewest hits and baserunners allowed.
Here’s where Francis ranks in the modern era for fewest hits allowed while averaging 7+ IP over spans of different lengths. I invite you to click on the links to see the company Francis is keeping, but suggest you open the links in new tabs and be patient as the queries may take a minute or more to return a result. Note that the two ranks shown are for all spans of the indicated length (potentially including overlapping spans for the same pitcher), and for the same but with overlapping spans removed.
- 3 games – 5 (T-15th/T-13th)
- 4 games – 6 (2nd/2nd)
- 5 games – 12 (T-9th/T-8th)
- 6 games – 13 (T-1st/T-1st)
- 7 games – 18 (T-2nd/T-2nd)
Here are the top 10 streaks for fewest hits over 7 games and 49+ IP (the gaps in the rank numbers indicate overlapping streaks that I’ve removed).
| Rk | Player | Team | Span Started | Span Ended | H | IP | W | L | GS | SV | BSv | CG | SHO | GF | IP | Dec | W-L% | ERA | H | R | ER | UER | HR | BB | IBB | SO | HBP | BK | WP | BF | BR | Ind. Games Link |
|---|---|---|---|---|---|---|---|---|---|---|---|---|---|---|---|---|---|---|---|---|---|---|---|---|---|---|---|---|---|---|---|---|
| 1 | Johan Santana | MIN | 2004-07-01 | 2004-08-01 | 16 | 54.0 | 4 | 2 | 7 | 0 | 0 | 1 | 1 | 0 | 54.0 | 6 | .667 | 1.33 | 16 | 10 | 8 | 2 | 6 | 16 | 0 | 73 | 3 | 0 | 3 | 193 | 36 | Games List |
| 2 | Bowden Francis | TOR | 2024-08-12 | 2024-09-18 | 18 | 49.0 | 4 | 2 | 7 | 0 | 0 | 0 | 0 | 0 | 49.0 | 6 | .667 | 1.47 | 18 | 8 | 8 | 0 | 6 | 5 | 0 | 45 | 5 | 0 | 0 | 174 | 29 | Games List |
| 3 | Justin Verlander | HOU | 2019-04-19 | 2019-05-21 | 18 | 49.1 | 6 | 1 | 7 | 0 | 0 | 0 | 0 | 0 | 49.1 | 7 | .857 | 1.64 | 18 | 9 | 9 | 0 | 8 | 11 | 0 | 59 | 1 | 0 | 0 | 178 | 31 | Games List |
| 5 | Whitey Ford | NYY | 1955-08-19 | 1955-09-11 (2) | 19 | 53.1 | 4 | 1 | 6 | 1 | 0 | 5 | 1 | 1 | 53.1 | 5 | .800 | 1.18 | 19 | 9 | 7 | 2 | 4 | 27 | 3 | 30 | 0 | 0 | 2 | 201 | 47 | Games List |
| 6 | Ferdie Schupp | NYG | 1916-09-05 | 1916-09-28 (2) | 19 | 56.0 | 6 | 0 | 6 | 0 | 0 | 6 | 4 | 1 | 56.0 | 6 | 1.000 | 0.32 | 19 | 4 | 2 | 2 | 1 | 10 | 0 | 26 | 1 | 0 | 0 | 194 | 33 | Games List |
| 8 | Ed Reulbach | CHC | 1906-08-17 | 1906-09-14 | 19 | 52.1 | 6 | 0 | 6 | 0 | 5 | 3 | 1 | 52.1 | 6 | 1.000 | 0.00 | 19 | 2 | 0 | 0 | 0 | 11 | 29 | 4 | 0 | 0 | 184 | 34 | Games List | ||
| 14 | Randy Johnson | ARI | 2004-04-16 | 2004-05-18 | 20 | 50.0 | 4 | 3 | 7 | 0 | 0 | 2 | 2 | 0 | 50.0 | 7 | .571 | 1.62 | 20 | 12 | 9 | 3 | 3 | 9 | 0 | 68 | 2 | 0 | 1 | 181 | 33 | Games List |
| 15 | Mario Soto | CIN | 1984-05-02 | 1984-06-06 | 20 | 51.0 | 5 | 0 | 7 | 0 | 0 | 4 | 0 | 0 | 51.0 | 5 | 1.000 | 1.94 | 20 | 12 | 11 | 1 | 6 | 18 | 0 | 48 | 0 | 0 | 2 | 189 | 42 | Games List |
| 16 | Ewell Blackwell | CIN | 1950-08-28 | 1950-09-20 (1) | 20 | 53.1 | 4 | 2 | 6 | 1 | 0 | 6 | 1 | 1 | 53.1 | 6 | .667 | 1.18 | 20 | 10 | 7 | 3 | 1 | 25 | 1 | 36 | 3 | 0 | 1 | 205 | 52 | Games List |
| 17 | Claude Hendrix | CHI | 1914-08-31 (2) | 1914-09-15 | 20 | 50.0 | 5 | 0 | 5 | 0 | 4 | 2 | 2 | 50.0 | 5 | 1.000 | 0.36 | 20 | 6 | 2 | 4 | 0 | 10 | 0 | 23 | 0 | 0 | 1 | 178 | 30 | Games List | |
| 18 | Rube Marquard | NYG | 1911-08-14 (1) | 1911-09-02 | 20 | 50.1 | 5 | 0 | 6 | 1 | 5 | 2 | 1 | 50.1 | 5 | 1.000 | 0.36 | 20 | 8 | 2 | 0 | 0 | 13 | 0 | 53 | 1 | 0 | 0 | 186 | 34 | Games List | |
| 19 | Jimmy Dygert | PHA | 1907-09-12 | 1907-10-03 | 20 | 49.0 | 6 | 0 | 6 | 0 | 5 | 2 | 1 | 49.0 | 6 | 1.000 | 0.00 | 20 | 7 | 0 | 0 | 0 | 11 | 38 | 3 | 0 | 0 | 164 | 34 | Games List |
For fewest baserunners allowed, the results are even sightly better, again while averaging 7+ IP over:
- 3 games – 9 (T-11th/T-11th)
- 4 games – 11 (2nd/2nd)
- 5 games – 18 (T-6th/T-6th)
- 6 games – 22 (1st/1st)
- 7 games – 29 (T-2nd/T-2nd)
Here are the top 10 streaks for fewest baseruneers over 7 games and 49+ IP, again with overlapping streaks removed.
| Rk | Player | Team | Span Started | Span Ended | BR | IP | W | L | GS | SV | BSv | CG | SHO | GF | IP | Dec | W-L% | ERA | H | R | ER | UER | HR | BB | IBB | SO | HBP | BK | WP | BF | BR | Ind. Games Link |
|---|---|---|---|---|---|---|---|---|---|---|---|---|---|---|---|---|---|---|---|---|---|---|---|---|---|---|---|---|---|---|---|---|
| 1 | Eddie Plank | SLB | 1916-07-17 | 1916-08-17 (1) | 28 | 49.1 | 4 | 2 | 6 | 1 | 4 | 2 | 1 | 49.1 | 6 | .667 | 1.09 | 21 | 9 | 6 | 3 | 2 | 6 | 17 | 1 | 0 | 0 | 175 | 28 | Games List | ||
| 2 | Bowden Francis | TOR | 2024-08-12 | 2024-09-18 | 29 | 49.0 | 4 | 2 | 7 | 0 | 0 | 0 | 0 | 0 | 49.0 | 6 | .667 | 1.47 | 18 | 8 | 8 | 0 | 6 | 5 | 0 | 45 | 5 | 0 | 0 | 174 | 29 | Games List |
| 3 | Christy Mathewson | NYG | 1909-08-21 | 1909-09-11 (1) | 29 | 49.0 | 5 | 1 | 6 | 1 | 5 | 3 | 1 | 49.0 | 6 | .833 | 0.00 | 28 | 10 | 0 | 0 | 0 | 1 | 26 | 0 | 0 | 1 | 171 | 29 | Games List | ||
| 4 | Justin Verlander | HOU | 2019-08-16 | 2019-09-17 | 30 | 49.1 | 4 | 2 | 7 | 0 | 0 | 2 | 1 | 0 | 49.1 | 6 | .667 | 1.46 | 23 | 8 | 8 | 0 | 5 | 6 | 0 | 66 | 1 | 0 | 0 | 173 | 30 | Games List |
| 5 | Claude Hendrix | CHI | 1914-08-31 (2) | 1914-09-15 | 30 | 50.0 | 5 | 0 | 5 | 0 | 4 | 2 | 2 | 50.0 | 5 | 1.000 | 0.36 | 20 | 6 | 2 | 4 | 0 | 10 | 0 | 23 | 0 | 0 | 1 | 178 | 30 | Games List | |
| 6 | Ed Walsh | CHW | 1910-08-04 | 1910-08-23 | 30 | 50.2 | 3 | 1 | 5 | 2 | 4 | 4 | 2 | 50.2 | 4 | .750 | 0.00 | 22 | 6 | 0 | 0 | 0 | 8 | 49 | 0 | 1 | 1 | 184 | 30 | Games List | ||
| 7 | Gerrit Cole | HOU | 2019-08-22 | 2019-09-24 | 31 | 50.2 | 5 | 0 | 7 | 0 | 0 | 0 | 0 | 0 | 50.2 | 5 | 1.000 | 1.42 | 24 | 9 | 8 | 1 | 4 | 7 | 0 | 90 | 0 | 2 | 3 | 181 | 31 | Games List |
| 8 | Justin Verlander | HOU | 2019-04-19 | 2019-05-21 | 31 | 49.1 | 6 | 1 | 7 | 0 | 0 | 0 | 0 | 0 | 49.1 | 7 | .857 | 1.64 | 18 | 9 | 9 | 0 | 8 | 11 | 0 | 59 | 1 | 0 | 0 | 178 | 31 | Games List |
| 10 | Clayton Kershaw | LAD | 2016-05-01 | 2016-06-04 | 31 | 55.2 | 6 | 0 | 7 | 0 | 0 | 3 | 3 | 0 | 55.2 | 6 | 1.000 | 0.81 | 27 | 5 | 5 | 0 | 1 | 3 | 0 | 69 | 1 | 3 | 0 | 191 | 31 | Games List |
| 11 | Jake Arrieta | CHC | 2015-08-30 | 2015-10-02 | 31 | 55.0 | 6 | 0 | 7 | 0 | 0 | 2 | 2 | 0 | 55.0 | 6 | 1.000 | 0.33 | 22 | 3 | 2 | 1 | 1 | 5 | 0 | 58 | 1 | 0 | 1 | 190 | 31 | Games List |
| 14 | Christy Mathewson | NYG | 1909-06-23 (2) | 1909-07-16 | 31 | 49.0 | 6 | 0 | 6 | 0 | 3 | 1 | 1 | 49.0 | 6 | 1.000 | 0.00 | 26 | 6 | 0 | 0 | 1 | 5 | 26 | 0 | 0 | 1 | 172 | 31 | Games List | ||
| 15 | Ed Walsh | CHW | 1908-09-21 | 1908-10-03 | 31 | 55.2 | 4 | 2 | 6 | 1 | 6 | 3 | 1 | 55.2 | 6 | .667 | 0.00 | 26 | 4 | 0 | 0 | 0 | 3 | 51 | 2 | 0 | 1 | 192 | 31 | Games List | ||
| 16 | Christy Mathewson | NYG | 1908-05-29 | 1908-06-23 (1) | 31 | 55.0 | 5 | 1 | 6 | 1 | 6 | 3 | 1 | 55.0 | 6 | .833 | 0.00 | 25 | 8 | 0 | 0 | 1 | 5 | 44 | 1 | 0 | 0 | 199 | 31 | Games List |
Obviously, Francis’s totals must be considered in terms of the innings he pitched, and pitchers in years past will have averaged considerably more than 7 IP per outing (or may be missing from these lists for that reason). Consider that caveat in how you choose to interpret these results.
For context, there have been 957 pitchers who recorded at least one season of the past twenty (since 2005) with 10 or more starts. Of these, only 254 (37%) recorded one or more spans of 7 games in which they averaged 7+ IP. That number, though, has declined dramatically during this period as shown below, to the point where fewer than 5% of pitchers since 2020 have recorded such a span in a season of 10+ starts.
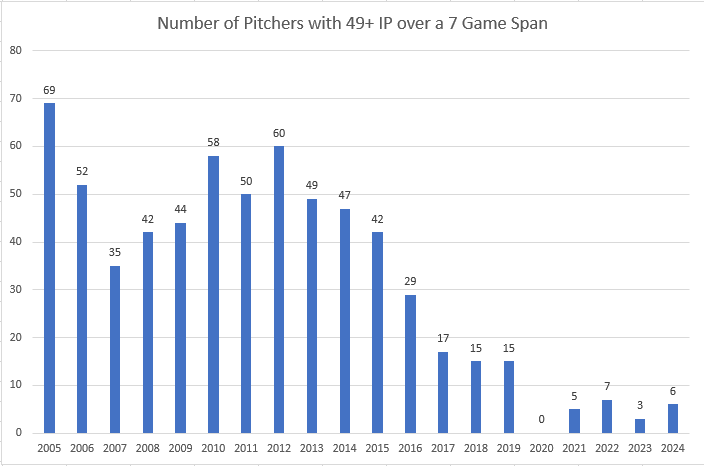
Of note are the 69 pitchers who recorded such a span in 2005, one more than all of the pitchers who have done so over the past eight seasons.
So, where did pitching like this come from? Actually, there were indicators of what was possible in Francis’s 2023 rookie season in which he posted a stellar 0.826 WHIP, the 12th lowest mark among rookie relievers in 30+ IP seasons with 200+ ERA+.
| Rk | Player | WHIP | ERA+ | Place | Season | Age | Team | Lg | W | L | W-L% | Dec | ERA | G | GS | CG | SHO | SV | IP | H | R | ER | HR | BB | IBB | SO | HBP | BK | WP | BF | ERA+ | FIP | WHIP | H9 | HR9 | BB9 | SO9 | SO/BB | Pos |
|---|---|---|---|---|---|---|---|---|---|---|---|---|---|---|---|---|---|---|---|---|---|---|---|---|---|---|---|---|---|---|---|---|---|---|---|---|---|---|---|
| 1 | Neftalí Feliz | 0.677 | 269 | 2009 | 21 | TEX | AL | 1 | 0 | 1.000 | 1 | 1.74 | 20 | 0 | 0 | 0 | 2 | 31.0 | 13 | 6 | 6 | 2 | 8 | 0 | 39 | 3 | 0 | 0 | 117 | 269 | 2.48 | 0.677 | 3.8 | 0.6 | 2.3 | 11.3 | 4.88 | ||
| 2 | Aaron Sanchez | 0.697 | 351 | 2014 | 21 | TOR | AL | 2 | 2 | .500 | 4 | 1.09 | 24 | 0 | 0 | 0 | 3 | 33.0 | 14 | 5 | 4 | 1 | 9 | 0 | 27 | 1 | 0 | 1 | 121 | 351 | 2.80 | 0.697 | 3.8 | 0.3 | 2.5 | 7.4 | 3.00 | 1 | |
| 3 | Sergio Romo | 0.706 | 209 | 2008 | 25 | SFG | NL | 3 | 1 | .750 | 4 | 2.12 | 29 | 0 | 0 | 0 | 0 | 34.0 | 16 | 13 | 8 | 3 | 8 | 1 | 33 | 3 | 0 | 0 | 130 | 209 | 3.31 | 0.706 | 4.2 | 0.8 | 2.1 | 8.7 | 4.13 | 1 | |
| 4 | Cla Meredith | 0.711 | 382 | 2006 | 23 | SDP | NL | 5 | 1 | .833 | 6 | 1.07 | 45 | 0 | 0 | 0 | 0 | 50.2 | 30 | 6 | 6 | 3 | 6 | 3 | 37 | 2 | 2 | 0 | 185 | 382 | 2.93 | 0.711 | 5.3 | 0.5 | 1.1 | 6.6 | 6.17 | 1 | |
| 5 | Bryan Hudson | 0.722 | 241 | 2024 | 27 | MIL | NL | 6 | 1 | .857 | 7 | 1.73 | 43 | 0 | 0 | 0 | 0 | 62.1 | 28 | 12 | 12 | 7 | 17 | 0 | 62 | 3 | 1 | 1 | 231 | 241 | 3.60 | 0.722 | 4.0 | 1.0 | 2.5 | 9.0 | 3.65 | ||
| 6 | Ryan Brasier | 0.772 | 277 | 2018 | 30 | BOS | AL | 2 | 0 | 1.000 | 2 | 1.60 | 34 | 0 | 0 | 0 | 0 | 33.2 | 19 | 6 | 6 | 2 | 7 | 0 | 29 | 0 | 0 | 1 | 124 | 277 | 2.83 | 0.772 | 5.1 | 0.5 | 1.9 | 7.8 | 4.14 | 1 | |
| 7 | Jonathan Papelbon | 0.776 | 517 | ROY-2 | 2006 | 25 | BOS | AL | 4 | 2 | .667 | 6 | 0.92 | 59 | 0 | 0 | 0 | 35 | 68.1 | 40 | 8 | 7 | 3 | 13 | 2 | 75 | 1 | 0 | 2 | 257 | 517 | 2.14 | 0.776 | 5.3 | 0.4 | 1.7 | 9.9 | 5.77 | 1 |
| 8 | Dellin Betances | 0.778 | 274 | ROY-3 | 2014 | 26 | NYY | AL | 5 | 0 | 1.000 | 5 | 1.40 | 70 | 0 | 0 | 0 | 1 | 90.0 | 46 | 15 | 14 | 4 | 24 | 1 | 135 | 4 | 1 | 2 | 341 | 274 | 1.64 | 0.778 | 4.6 | 0.4 | 2.4 | 13.5 | 5.63 | 1 |
| 9 | Pat Neshek | 0.784 | 206 | 2006 | 25 | MIN | AL | 4 | 2 | .667 | 6 | 2.19 | 32 | 0 | 0 | 0 | 0 | 37.0 | 23 | 9 | 9 | 6 | 6 | 0 | 53 | 0 | 0 | 0 | 138 | 206 | 2.88 | 0.784 | 5.6 | 1.5 | 1.5 | 12.9 | 8.83 | ||
| 10 | Ken Giles | 0.788 | 319 | ROY-4 | 2014 | 23 | PHI | NL | 3 | 1 | .750 | 4 | 1.18 | 44 | 0 | 0 | 0 | 1 | 45.2 | 25 | 7 | 6 | 1 | 11 | 1 | 64 | 0 | 0 | 1 | 166 | 319 | 1.34 | 0.788 | 4.9 | 0.2 | 2.2 | 12.6 | 5.82 | 1 |
| 11 | Rafael Soriano | 0.792 | 283 | 2003 | 23 | SEA | AL | 3 | 0 | 1.000 | 3 | 1.53 | 40 | 0 | 0 | 0 | 1 | 53.0 | 30 | 9 | 9 | 2 | 12 | 1 | 68 | 3 | 0 | 0 | 201 | 283 | 1.80 | 0.792 | 5.1 | 0.3 | 2.0 | 11.5 | 5.67 | 1 | |
| 12 | Bowden Francis | 0.826 | 249 | 2023 | 27 | TOR | AL | 1 | 0 | 1.000 | 1 | 1.73 | 20 | 0 | 0 | 0 | 1 | 36.1 | 22 | 7 | 7 | 5 | 8 | 0 | 35 | 1 | 2 | 1 | 136 | 249 | 3.86 | 0.826 | 5.4 | 1.2 | 2.0 | 8.7 | 4.38 | ||
| 13 | Caleb Thielbar | 0.826 | 233 | 2013 | 26 | MIN | AL | 3 | 2 | .600 | 5 | 1.76 | 49 | 0 | 0 | 0 | 0 | 46.0 | 24 | 11 | 9 | 4 | 14 | 4 | 39 | 0 | 0 | 1 | 171 | 233 | 3.40 | 0.826 | 4.7 | 0.8 | 2.7 | 7.6 | 2.79 | 1 | |
| 14 | Joey Devine | 0.832 | 698 | ROY-6 | 2008 | 24 | OAK | AL | 6 | 1 | .857 | 7 | 0.59 | 42 | 0 | 0 | 0 | 1 | 45.2 | 23 | 7 | 3 | 0 | 15 | 2 | 49 | 0 | 0 | 0 | 170 | 698 | 1.97 | 0.832 | 4.5 | 0.0 | 3.0 | 9.7 | 3.27 | 1 |
| 15 | Jeff Zimmerman | 0.833 | 215 | ROY-3 | 1999 | 26 | TEX | AL | 9 | 3 | .750 | 12 | 2.36 | 65 | 0 | 0 | 0 | 3 | 87.2 | 50 | 24 | 23 | 9 | 23 | 1 | 67 | 2 | 0 | 2 | 336 | 215 | 3.80 | 0.833 | 5.1 | 0.9 | 2.4 | 6.9 | 2.91 | 1 |
| 16 | Doug Henry | 0.833 | 406 | ROY-8 | 1991 | 27 | MIL | AL | 2 | 1 | .667 | 3 | 1.00 | 32 | 0 | 0 | 0 | 15 | 36.0 | 16 | 4 | 4 | 1 | 14 | 1 | 28 | 0 | 0 | 0 | 137 | 406 | 2.83 | 0.833 | 4.0 | 0.3 | 3.5 | 7.0 | 2.00 | 1 |
| 17 | Troy Percival | 0.851 | 241 | ROY-4 | 1995 | 25 | CAL | AL | 3 | 2 | .600 | 5 | 1.95 | 62 | 0 | 0 | 0 | 3 | 74.0 | 37 | 19 | 16 | 6 | 26 | 2 | 94 | 1 | 2 | 2 | 284 | 241 | 2.71 | 0.851 | 4.5 | 0.7 | 3.2 | 11.4 | 3.62 | |
| 18 | Mychal Givens | 0.867 | 230 | 2015 | 25 | BAL | AL | 2 | 0 | 1.000 | 2 | 1.80 | 22 | 0 | 0 | 0 | 0 | 30.0 | 20 | 7 | 6 | 1 | 6 | 0 | 38 | 1 | 0 | 0 | 117 | 230 | 1.73 | 0.867 | 6.0 | 0.3 | 1.8 | 11.4 | 6.33 | 1 | |
| 19 | Tyler Holton | 0.867 | 206 | 2023 | 27 | DET | AL | 3 | 2 | .600 | 5 | 2.11 | 59 | 1 | 0 | 0 | 1 | 85.1 | 56 | 21 | 20 | 9 | 18 | 1 | 74 | 1 | 0 | 4 | 324 | 206 | 3.56 | 0.867 | 5.9 | 0.9 | 1.9 | 7.8 | 4.11 | ||
| 20 | Andrew Bailey | 0.876 | 239 | ROY-1 | 2009 | 25 | OAK | AL | 6 | 3 | .667 | 9 | 1.84 | 68 | 0 | 0 | 0 | 26 | 83.1 | 49 | 17 | 17 | 5 | 24 | 3 | 91 | 0 | 0 | 6 | 323 | 239 | 2.56 | 0.876 | 5.3 | 0.5 | 2.6 | 9.8 | 3.79 | 1 |
That rookie campaign and Francis’s record run of games this season has allowed him to become the first pitcher in more than a century with a chance to allow fewer baserunners than innings pitched (minimum 125 IP) over the first 50 games of a career.
| Rk | Player | IP | BR | From | To | W | L | W-L% | ERA | G | GS | GF | CG | SHO | SV | IP | H | R | ER | UER | HR | BB | IBB | SO | HBP | BK | WP | BF | BR |
|---|---|---|---|---|---|---|---|---|---|---|---|---|---|---|---|---|---|---|---|---|---|---|---|---|---|---|---|---|---|
| 1 | Bowden Francis | 140.2 | 138 | 2022 | 2024 | 9 | 5 | .643 | 2.88 | 48 | 13 | 19 | 0 | 0 | 1 | 140.2 | 97 | 48 | 45 | 3 | 22 | 30 | 0 | 128 | 8 | 3 | 1 | 547 | 138 |
| 2 | Frank Arellanes | 294.1 | 294 | 1908 | 1909 | 20 | 11 | .645 | 0.00 | 50 | 34 | 16 | 23 | 2 | 7 | 294.1 | 235 | 85 | 0 | 0 | 3 | 52 | 110 | 7 | 0 | 5 | 1144 | 294 | |
| 3 | George McQuillan | 373.2 | 361 | 1907 | 1908 | 26 | 14 | .650 | 0.00 | 50 | 43 | 7 | 34 | 10 | 3 | 373.2 | 265 | 78 | 0 | 0 | 1 | 89 | 131 | 7 | 0 | 6 | 1430 | 361 |
As Francis still has two games to go to reach 50, we will have to wait until next year to see if he joins the other two. Speaking of which, you may have noticed the missing earned and unearned run data for Arellanes and McQuillan, and for some of the pitchers in the preceding lists. I believe Stathead validates the box score data by comparison to the play-by-play data. As there are no play-by-play data prior to 1912, the earned and unearned run totals and related calculations are not shown in queries of game level data.
Francis has also recorded the lowest WHIP in 100+ IP over the first three seasons of a career among pitchers who relieved in fewer than 80% of their games.
| Rk | Player | WHIP | GR | G | From | To | Age | W | L | W-L% | Dec | ERA | G | GS | CG | SHO | SV | IP | H | R | ER | HR | BB | IBB | SO | HBP | BK | WP | BF | ERA+ | FIP | WHIP | H9 | HR9 | BB9 | SO9 | SO/BB | GF | GR | Pos | Team |
|---|---|---|---|---|---|---|---|---|---|---|---|---|---|---|---|---|---|---|---|---|---|---|---|---|---|---|---|---|---|---|---|---|---|---|---|---|---|---|---|---|---|
| 1 | Bowden Francis | 0.903 | 35 | 48 | 2022 | 2024 | 26-28 | 9 | 5 | .643 | 14 | 2.88 | 48 | 13 | 0 | 0 | 1 | 140.2 | 97 | 48 | 45 | 22 | 30 | 0 | 128 | 8 | 3 | 1 | 547 | 143 | 4.21 | 0.903 | 6.2 | 1.4 | 1.9 | 8.2 | 4.27 | 19 | 35 | TOR | |
| 2 | Paul Skenes | 0.962 | 0 | 22 | 2024 | 2024 | 22 | 11 | 3 | .786 | 14 | 1.99 | 22 | 22 | 0 | 0 | 0 | 131.0 | 94 | 31 | 29 | 10 | 32 | 0 | 167 | 6 | 1 | 2 | 508 | 213 | 2.48 | 0.962 | 6.5 | 0.7 | 2.2 | 11.5 | 5.22 | 0 | 0 | PIT | |
| 3 | Dick Hughes | 0.967 | 34 | 68 | 1966 | 1968 | 28-30 | 20 | 9 | .690 | 29 | 2.79 | 68 | 34 | 13 | 4 | 8 | 307.0 | 221 | 101 | 95 | 29 | 76 | 12 | 230 | 7 | 2 | 8 | 1205 | 116 | 3.05 | 0.967 | 6.5 | 0.9 | 2.2 | 6.7 | 3.03 | 17 | 34 | 1/H | STL |
| 4 | Elmer Steele | 0.976 | 14 | 36 | 1907 | 1909 | 23-25 | 9 | 12 | .429 | 21 | 2.20 | 36 | 22 | 11 | 1 | 1 | 205.0 | 171 | 78 | 50 | 2 | 29 | 79 | 4 | 2 | 1 | 777 | 114 | 1.99 | 0.976 | 7.5 | 0.1 | 1.3 | 3.5 | 2.72 | 11 | 14 | 1 | BOS | |
| 5 | George McQuillan | 0.990 | 20 | 95 | 1907 | 1909 | 22-24 | 40 | 33 | .548 | 73 | 1.71 | 95 | 75 | 53 | 14 | 4 | 648.1 | 486 | 178 | 123 | 6 | 156 | 238 | 8 | 0 | 9 | 2484 | 144 | 2.30 | 0.990 | 6.7 | 0.1 | 2.2 | 3.3 | 1.53 | 18 | 20 | 1 | PHI | |
| 6 | Matt Harvey | 1.000 | 0 | 65 | 2012 | 2015 | 23-26 | 25 | 18 | .581 | 43 | 2.53 | 65 | 65 | 1 | 1 | 0 | 427.0 | 333 | 127 | 120 | 30 | 94 | 3 | 449 | 12 | 0 | 9 | 1690 | 146 | 2.65 | 1.000 | 7.0 | 0.6 | 2.0 | 9.5 | 4.78 | 0 | 0 | 1/H | NYM |
| 7 | Vida Blue | 1.008 | 8 | 57 | 1969 | 1971 | 19-21 | 27 | 9 | .750 | 36 | 2.36 | 57 | 49 | 26 | 10 | 1 | 392.2 | 278 | 119 | 103 | 32 | 118 | 4 | 360 | 5 | 1 | 11 | 1545 | 143 | 2.64 | 1.008 | 6.4 | 0.7 | 2.7 | 8.3 | 3.05 | 1 | 8 | 1 | OAK |
| 8 | José Fernández | 1.014 | 0 | 47 | 2013 | 2015 | 20-22 | 22 | 9 | .710 | 31 | 2.40 | 47 | 47 | 0 | 0 | 0 | 289.0 | 208 | 87 | 77 | 18 | 85 | 6 | 336 | 7 | 2 | 7 | 1151 | 160 | 2.52 | 1.014 | 6.5 | 0.6 | 2.6 | 10.5 | 3.95 | 0 | 0 | 1 | MIA |
| 9 | Ed Reulbach | 1.016 | 19 | 94 | 1905 | 1907 | 22-24 | 54 | 22 | .711 | 76 | 1.56 | 94 | 75 | 64 | 15 | 4 | 701.2 | 484 | 170 | 122 | 4 | 229 | 342 | 40 | 2 | 10 | 2715 | 174 | 2.63 | 1.016 | 6.2 | 0.1 | 2.9 | 4.4 | 1.49 | 19 | 19 | 1/H9 | CHC | |
| 10 | Addie Joss | 1.018 | 5 | 89 | 1902 | 1904 | 22-24 | 49 | 36 | .576 | 85 | 2.25 | 89 | 84 | 79 | 13 | 0 | 745.1 | 617 | 276 | 186 | 5 | 142 | 309 | 29 | 1 | 13 | 2904 | 134 | 2.58 | 1.018 | 7.5 | 0.1 | 1.7 | 3.7 | 2.18 | 4 | 5 | 1/3H | CLE |
Admittedly, Francis falls just below that 80% relief games threshold. For a more apples to apples comparison, here are the lowest WHIP in 100+ IP over the first three seasons of a career with 20% or more of games as starter and 60% or more in relief.
| Rk | Player | WHIP | GR | G | GS | From | To | Age | W | L | W-L% | Dec | ERA | G | GS | CG | SHO | SV | IP | H | R | ER | HR | BB | IBB | SO | HBP | BK | WP | BF | ERA+ | FIP | WHIP | H9 | HR9 | BB9 | SO9 | SO/BB | GF | GR | Pos | Team |
|---|---|---|---|---|---|---|---|---|---|---|---|---|---|---|---|---|---|---|---|---|---|---|---|---|---|---|---|---|---|---|---|---|---|---|---|---|---|---|---|---|---|---|
| 1 | Bowden Francis | 0.903 | 35 | 48 | 13 | 2022 | 2024 | 26-28 | 9 | 5 | .643 | 14 | 2.88 | 48 | 13 | 0 | 0 | 1 | 140.2 | 97 | 48 | 45 | 22 | 30 | 0 | 128 | 8 | 3 | 1 | 547 | 143 | 4.21 | 0.903 | 6.2 | 1.4 | 1.9 | 8.2 | 4.27 | 19 | 35 | TOR | |
| 2 | Mellie Wolfgang | 1.080 | 41 | 68 | 27 | 1914 | 1916 | 24-26 | 15 | 13 | .536 | 28 | 1.92 | 68 | 27 | 15 | 3 | 0 | 300.0 | 238 | 99 | 64 | 2 | 86 | 107 | 3 | 0 | 3 | 1164 | 145 | 2.64 | 1.080 | 7.1 | 0.1 | 2.6 | 3.2 | 1.24 | 32 | 41 | 1/5H | CHW | |
| 3 | Billy O’Dell | 1.081 | 28 | 46 | 18 | 1954 | 1957 | 21-24 | 5 | 11 | .313 | 16 | 2.62 | 46 | 18 | 3 | 1 | 4 | 164.2 | 128 | 56 | 48 | 12 | 50 | 3 | 109 | 5 | 0 | 0 | 661 | 137 | 3.07 | 1.081 | 7.0 | 0.7 | 2.7 | 6.0 | 2.18 | 12 | 28 | 1/H | BAL |
| 4 | Jeff Heathcock | 1.094 | 27 | 39 | 12 | 1983 | 1987 | 23-27 | 9 | 4 | .692 | 13 | 3.26 | 39 | 12 | 1 | 0 | 3 | 127.0 | 113 | 54 | 46 | 14 | 26 | 1 | 52 | 3 | 2 | 3 | 511 | 111 | 4.06 | 1.094 | 8.0 | 1.0 | 1.8 | 3.7 | 2.00 | 9 | 27 | 1 | HOU |
| 5 | Alexi Ogando | 1.102 | 103 | 133 | 30 | 2010 | 2012 | 26-28 | 19 | 9 | .679 | 28 | 3.12 | 133 | 30 | 1 | 1 | 3 | 276.2 | 229 | 105 | 96 | 27 | 76 | 3 | 231 | 10 | 0 | 13 | 1127 | 142 | 3.58 | 1.102 | 7.4 | 0.9 | 2.5 | 7.5 | 3.04 | 25 | 103 | 1 | TEX |
| 6 | Tanner Houck | 1.123 | 33 | 53 | 20 | 2020 | 2022 | 24-26 | 9 | 9 | .500 | 18 | 3.02 | 53 | 20 | 0 | 0 | 9 | 146.0 | 112 | 56 | 49 | 8 | 52 | 4 | 164 | 13 | 0 | 7 | 595 | 150 | 2.95 | 1.123 | 6.9 | 0.5 | 3.2 | 10.1 | 3.15 | 16 | 33 | 1 | BOS |
| 7 | Chris Sale | 1.125 | 80 | 109 | 29 | 2010 | 2012 | 21-23 | 21 | 11 | .656 | 32 | 2.89 | 109 | 29 | 1 | 0 | 12 | 286.1 | 234 | 93 | 92 | 27 | 88 | 8 | 303 | 8 | 0 | 9 | 1152 | 148 | 3.19 | 1.125 | 7.4 | 0.8 | 2.8 | 9.5 | 3.44 | 25 | 80 | 1 | CHW |
| 8 | Óscar Tuero | 1.137 | 39 | 58 | 19 | 1918 | 1920 | 24-26 | 6 | 9 | .400 | 15 | 2.88 | 58 | 19 | 6 | 0 | 4 | 199.2 | 174 | 87 | 64 | 4 | 53 | 58 | 13 | 1 | 6 | 812 | 98 | 3.10 | 1.137 | 7.8 | 0.2 | 2.4 | 2.6 | 1.09 | 28 | 39 | 1/H | STL | |
| 9 | Ryan Yarbrough | 1.152 | 48 | 77 | 29 | 2018 | 2020 | 26-28 | 28 | 16 | .636 | 44 | 3.94 | 77 | 29 | 0 | 0 | 0 | 344.2 | 315 | 161 | 151 | 38 | 82 | 9 | 289 | 24 | 1 | 3 | 1425 | 107 | 3.87 | 1.152 | 8.2 | 1.0 | 2.1 | 7.5 | 3.52 | 4 | 48 | 1 | TBR |
| 10 | Pedro Martínez | 1.155 | 65 | 91 | 26 | 1992 | 1994 | 20-22 | 21 | 11 | .656 | 32 | 3.05 | 91 | 26 | 1 | 1 | 3 | 259.2 | 197 | 94 | 88 | 16 | 103 | 7 | 269 | 15 | 1 | 9 | 1059 | 133 | 3.15 | 1.155 | 6.8 | 0.6 | 3.6 | 9.3 | 2.61 | 22 | 65 | 1 | LAD,MON |
If there’s a chink in Francis’s armor, it would have to be the long ball that was his undoing in his two no-hit bids. Francis’s 1.4 HR/9 leads all pitchers with 20% starts and 60% relief outings in 100+ IP with 120+ ERA+ over the first three seasons of a career.
| Rk | Player | HR9 | GS | G | GR | ERA+ | From | To | Age | W | L | W-L% | Dec | ERA | G | GS | CG | SHO | SV | IP | H | R | ER | HR | BB | IBB | SO | HBP | BK | WP | BF | ERA+ | FIP | WHIP | H9 | HR9 | BB9 | SO9 | SO/BB | GF | GR | Pos | Team |
|---|---|---|---|---|---|---|---|---|---|---|---|---|---|---|---|---|---|---|---|---|---|---|---|---|---|---|---|---|---|---|---|---|---|---|---|---|---|---|---|---|---|---|---|
| 1 | Bowden Francis | 1.4 | 13 | 48 | 35 | 143 | 2022 | 2024 | 26-28 | 9 | 5 | .643 | 14 | 2.88 | 48 | 13 | 0 | 0 | 1 | 140.2 | 97 | 48 | 45 | 22 | 30 | 0 | 128 | 8 | 3 | 1 | 547 | 143 | 4.21 | 0.903 | 6.2 | 1.4 | 1.9 | 8.2 | 4.27 | 19 | 35 | TOR | |
| 2 | Héctor Santiago | 1.1 | 27 | 78 | 51 | 124 | 2011 | 2013 | 23-25 | 8 | 10 | .444 | 18 | 3.41 | 78 | 27 | 0 | 0 | 4 | 224.2 | 192 | 95 | 85 | 27 | 113 | 4 | 218 | 22 | 2 | 8 | 980 | 124 | 4.49 | 1.358 | 7.7 | 1.1 | 4.5 | 8.7 | 1.93 | 24 | 51 | 1 | CHW |
| 3 | Drew Smyly | 0.9 | 43 | 114 | 71 | 124 | 2012 | 2014 | 23-25 | 19 | 13 | .594 | 32 | 3.26 | 114 | 43 | 1 | 1 | 2 | 328.1 | 291 | 126 | 119 | 34 | 92 | 4 | 308 | 4 | 0 | 16 | 1337 | 124 | 3.45 | 1.166 | 8.0 | 0.9 | 2.5 | 8.4 | 3.35 | 9 | 71 | 1 | DET,TBR |
| 4 | Dave DeBusschere | 0.9 | 10 | 36 | 26 | 124 | 1962 | 1963 | 21-22 | 3 | 4 | .429 | 7 | 2.90 | 36 | 10 | 1 | 1 | 0 | 102.1 | 85 | 42 | 33 | 10 | 57 | 2 | 61 | 5 | 0 | 8 | 447 | 124 | 4.40 | 1.388 | 7.5 | 0.9 | 5.0 | 5.4 | 1.07 | 12 | 26 | 1 | CHW |
| 5 | Alexi Ogando | 0.9 | 30 | 133 | 103 | 142 | 2010 | 2012 | 26-28 | 19 | 9 | .679 | 28 | 3.12 | 133 | 30 | 1 | 1 | 3 | 276.2 | 229 | 105 | 96 | 27 | 76 | 3 | 231 | 10 | 0 | 13 | 1127 | 142 | 3.58 | 1.102 | 7.4 | 0.9 | 2.5 | 7.5 | 3.04 | 25 | 103 | 1 | TEX |
| 6 | Jim Konstanty | 0.8 | 13 | 36 | 23 | 121 | 1944 | 1948 | 27-31 | 7 | 5 | .583 | 12 | 2.94 | 36 | 13 | 5 | 1 | 2 | 137.2 | 137 | 56 | 45 | 13 | 42 | 7 | 35 | 1 | 0 | 3 | 568 | 121 | 4.33 | 1.300 | 9.0 | 0.8 | 2.7 | 2.3 | 0.83 | 11 | 23 | 1 | BSN,CIN,PHI |
| 7 | Chris Sale | 0.8 | 29 | 109 | 80 | 148 | 2010 | 2012 | 21-23 | 21 | 11 | .656 | 32 | 2.89 | 109 | 29 | 1 | 0 | 12 | 286.1 | 234 | 93 | 92 | 27 | 88 | 8 | 303 | 8 | 0 | 9 | 1152 | 148 | 3.19 | 1.125 | 7.4 | 0.8 | 2.8 | 9.5 | 3.44 | 25 | 80 | 1 | CHW |
| 8 | Mike Montgomery | 0.8 | 37 | 109 | 72 | 120 | 2015 | 2017 | 25-27 | 15 | 19 | .441 | 34 | 3.45 | 109 | 37 | 2 | 2 | 3 | 320.2 | 274 | 134 | 123 | 29 | 130 | 7 | 256 | 22 | 0 | 27 | 1349 | 120 | 4.15 | 1.260 | 7.7 | 0.8 | 3.6 | 7.2 | 1.97 | 29 | 72 | 1 | CHC,SEA |
| 9 | Ricky Horton | 0.7 | 30 | 128 | 98 | 123 | 1984 | 1986 | 24-26 | 16 | 9 | .640 | 25 | 2.91 | 128 | 30 | 2 | 1 | 5 | 315.2 | 301 | 108 | 102 | 26 | 99 | 22 | 184 | 5 | 8 | 9 | 1306 | 123 | 3.64 | 1.267 | 8.6 | 0.7 | 2.8 | 5.2 | 1.86 | 29 | 98 | 1/H | STL |
| 10 | José Soriano | 0.7 | 20 | 60 | 40 | 122 | 2023 | 2024 | 24-25 | 7 | 10 | .412 | 17 | 3.48 | 60 | 20 | 0 | 0 | 0 | 155.0 | 124 | 72 | 60 | 12 | 68 | 3 | 153 | 16 | 1 | 9 | 653 | 122 | 3.85 | 1.239 | 7.2 | 0.7 | 3.9 | 8.9 | 2.25 | 7 | 40 | LAA | |
| 11 | Tom Hall | 0.7 | 33 | 91 | 58 | 129 | 1968 | 1970 | 20-22 | 21 | 14 | .600 | 35 | 2.87 | 91 | 33 | 6 | 2 | 4 | 325.2 | 250 | 124 | 104 | 24 | 128 | 10 | 294 | 3 | 0 | 10 | 1330 | 129 | 2.92 | 1.161 | 6.9 | 0.7 | 3.5 | 8.1 | 2.30 | 17 | 58 | 1/H | MIN |
| 12 | Billy O’Dell | 0.7 | 18 | 46 | 28 | 137 | 1954 | 1957 | 21-24 | 5 | 11 | .313 | 16 | 2.62 | 46 | 18 | 3 | 1 | 4 | 164.2 | 128 | 56 | 48 | 12 | 50 | 3 | 109 | 5 | 0 | 0 | 661 | 137 | 3.07 | 1.081 | 7.0 | 0.7 | 2.7 | 6.0 | 2.18 | 12 | 28 | 1/H | BAL |
| 13 | Adam Wainwright | 0.6 | 32 | 95 | 63 | 122 | 2005 | 2007 | 23-25 | 16 | 13 | .552 | 29 | 3.61 | 95 | 32 | 1 | 0 | 3 | 279.0 | 278 | 122 | 112 | 20 | 93 | 6 | 208 | 13 | 0 | 9 | 1200 | 122 | 3.79 | 1.330 | 9.0 | 0.6 | 3.0 | 6.7 | 2.24 | 11 | 63 | 1/H | STL |
| 14 | Hugh Casey | 0.6 | 35 | 97 | 62 | 125 | 1935 | 1940 | 21-26 | 26 | 18 | .591 | 44 | 3.25 | 97 | 35 | 20 | 2 | 3 | 407.0 | 393 | 164 | 147 | 28 | 119 | 20 | 142 | 17 | 1 | 9 | 1728 | 125 | 3.98 | 1.258 | 8.7 | 0.6 | 2.6 | 3.1 | 1.19 | 36 | 62 | 1/H | BRO,CHC |
| 15 | Steve Sundra | 0.6 | 19 | 50 | 31 | 123 | 1936 | 1939 | 26-29 | 17 | 5 | .773 | 22 | 3.62 | 50 | 19 | 11 | 1 | 0 | 216.1 | 219 | 104 | 87 | 14 | 101 | 4 | 61 | 0 | 0 | 7 | 946 | 123 | 4.48 | 1.479 | 9.1 | 0.6 | 4.2 | 2.5 | 0.60 | 24 | 31 | 1 | NYY |
| 16 | Pedro Martínez | 0.6 | 26 | 91 | 65 | 133 | 1992 | 1994 | 20-22 | 21 | 11 | .656 | 32 | 3.05 | 91 | 26 | 1 | 1 | 3 | 259.2 | 197 | 94 | 88 | 16 | 103 | 7 | 269 | 15 | 1 | 9 | 1059 | 133 | 3.15 | 1.155 | 6.8 | 0.6 | 3.6 | 9.3 | 2.61 | 22 | 65 | 1 | LAD,MON |
Time will tell what becomes of Francis for the remainder of his career. But, he can always look back fondly at August and September of 2024 when he was in a zone the likes of which few other pitchers have experienced.