The 3-0 pitch is possibly one of the most predictable events in baseball, a short interlude in which the competitive game usually takes a break. We’ve all seen it – the hitter resting his bat on his shoulder and affecting body language that tells everyone in the ballpark that he won’t be swinging. And, the pitcher responding by grooving a center cut fastball. Heck, even the umpire gets into the act, expanding his strike zone to include anything even close to being a strike. After this, the game resumes, with the batter suddenly dialed in and looking to do some damage to the still vulnerable pitcher. As familiar as that scenario seems, things have been changing in recent years, as more hitters are taking their cuts on 3-0 offerings. More after the jump.
A few years ago, I posted a piece titled “Pivotal Pitches” that looked at how transitions in the ball-strike count (e.g. going from a 1-1 count to a 2-1 or 1-2 count) affect the expected outcome a plate appearance. Among other things, that piece identified how often a ball is put into play on each count, and the damage done (or not) by those balls in play. It will surprise nobody that fewer balls are put in play on a 3-0 count than any other, and it will probably also not be surprising that more damage is done when a ball is put in play on a 3-0 count than in any other. Which, of course, begs the question “if a BIP on a 3-0 count is so richly rewarded, why aren’t more hitters going after that pitch?”.
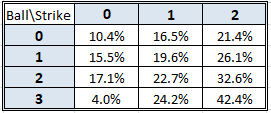
For the current 2018 season, the BIP results by count look like this.  The percentage numbers should be interpreted as batted balls in play (incl. HR) on each count as a percentage of all PAs that included that count. The 3-0 count has the lowest BIP% by far, less than half of the next lowest mark, on the first pitch of a PA. But, it may surprise you to learn that that lowly 4.0% BIP on a 3-0 count is more than 50% higher than the 2.5% mark in the 2009 season, just nine years ago.
In fact, BIP rates on 3-0 counts have shown fairly wide swings in the 30+ seasons that such things have been recorded, as shown in the chart below. The BIP rate for 3-0 counts is shown by the blue line which, after 15 years of decline, has been on the rebound in the current decade, a rare occurrence of increasing BIP in a period of rising strikeouts and declining balls in play. More significant than the rise in 3-0 BIP however has been what hitters have done with those balls in play, showing major improvements over the past five years in BA, SLG and OPS over rates posted for all PA including a 3-0 count. The current 2018 mark of a .562 OPS bulge is virtually tied with the .563 mark in 2010 for the highest of the past 30+ seasons.
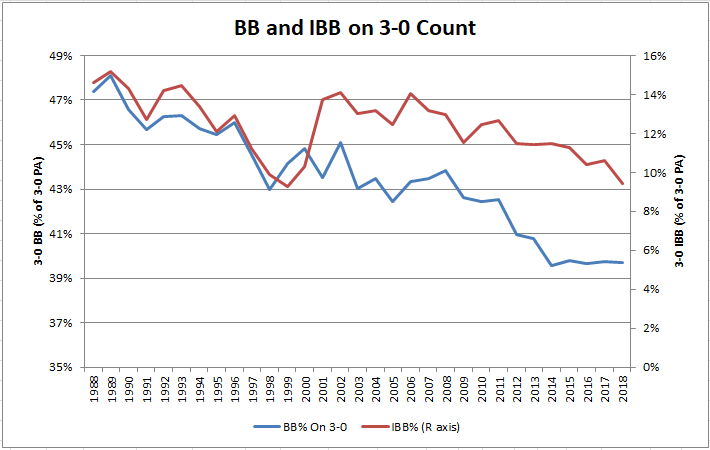
The traditional rationale for taking the 3-0 pitch has gone something like “if the pitcher is trying to walk you, then let him”. That’s fine if a walk is your objective. But, with the BA, SLG and OPS advantages seen in the previous chart, perhaps sights should be set higher. Taking a shot on a 3-0 pitch and, perhaps, fouling it off, doesn’t really hurt you, since the likelihood of eventually drawing a walk remains about the same, as shown in the chart below.  While there may not be a particular advantage in working a walk on the 3-0 pitch versus later in the count, the chart above does show a steady decline in walks on a 3-0 count, more clearly depicted in the chart below.
 Part of the decline in 3-0 walks is indicated by the similar decline in IBBs on 3-0 counts (the brief upward bump in IBBs in the middle of the period is likely related to a certain slugger aptly bearing the initials “BB”). What’s also notable about this trend is that it has been steady throughout the past 30 seasons, despite BIP% on a 3-0 count showing distinct upward and downward trends over that period. The explanation could be that pitchers became more aggressive on 3-0 when batters were more passive, while both batters and pitchers have become more aggressive in that count over the past 8 or 9 years.
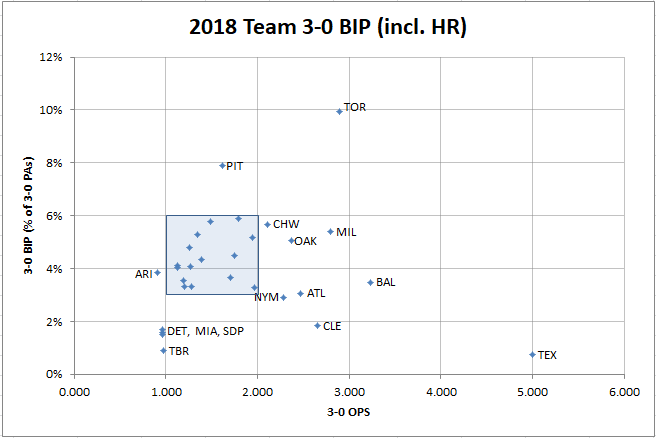
Getting back to the 2018 season, here are the teams that have been most successful in putting the ball in play on a 3-0 count. The chart plots BIP% against OPS for the 3-0 count, with half of teams in the shaded blue area and the identified outliers outside of it. The OPS numbers are quite volatile and subject to significant change; Texas is the prime example, with its 5.000 OPS coming on a home run in the team’s only 3-0 ball in play. At the other extreme are the Blue Jays who hit their sixth home run on a 3-0 count on June 15th, more than one-quarter of the major league total of 22 and tying the team record for a full season since 1988.
Among active players, only these two have compiled 40 ABs with a 3-0 count.
| Rk | Player | Split | From | To | G | AB | PA | R | H | 2B | 3B | HR | RBI | SB | CS | BB | SO | BA | OBP | SLG | OPS | TB | IBB | BAbip |
|---|---|---|---|---|---|---|---|---|---|---|---|---|---|---|---|---|---|---|---|---|---|---|---|---|
| 1 | Albert Pujols | 3-0 Count | 2001 | 2018 | 572 | 98 | 645 | 14 | 37 | 9 | 1 | 7 | 28 | 2 | 2 | 547 | 0 | .378 | .905 | .704 | 1.610 | 69 | 293 | .330 |
| 2 | Victor Martinez | 3-0 Count | 2002 | 2018 | 261 | 60 | 285 | 11 | 25 | 3 | 0 | 5 | 20 | 0 | 0 | 223 | 0 | .417 | .870 | .717 | 1.587 | 43 | 108 | .351 |
They are among 29 players since 1988 with 40 ABs with a 3-0 count, all of whom posted at least a 1.300 OPS in that split. The top performers are these fifteen who batted .350 and slugged .750. Of this group, only Bonds (obviously) and Palmeiro failed to record at least a 10% BIP on 3-0 counts, while McGriff, Sosa and Gonzo topped 20% (and the Big Hurt would have too, with one more BIP).
| Rk | Player | Split | From | To | G | AB | PA | R | H | 2B | 3B | HR | RBI | SB | CS | BB | SO | BA | OBP | SLG | OPS | TB | IBB | BAbip |
|---|---|---|---|---|---|---|---|---|---|---|---|---|---|---|---|---|---|---|---|---|---|---|---|---|
| 1 | Fred McGriff | 3-0 Count | 1988 | 2004 | 394 | 122 | 439 | 21 | 53 | 8 | 2 | 13 | 46 | 0 | 0 | 313 | 0 | .434 | .836 | .852 | 1.688 | 104 | 148 | .357 |
| 2 | Frank Thomas | 3-0 Count | 1990 | 2008 | 482 | 107 | 539 | 22 | 39 | 10 | 0 | 11 | 31 | 0 | 0 | 430 | 0 | .364 | .872 | .766 | 1.638 | 82 | 154 | .289 |
| 3 | Ken Griffey | 3-0 Count | 1989 | 2010 | 526 | 77 | 585 | 18 | 29 | 3 | 1 | 9 | 26 | 1 | 0 | 508 | 0 | .377 | .918 | .792 | 1.710 | 61 | 232 | .294 |
| 4 | Sammy Sosa | 3-0 Count | 1989 | 2007 | 320 | 69 | 343 | 24 | 35 | 9 | 1 | 15 | 36 | 2 | 0 | 274 | 0 | .507 | .901 | 1.319 | 2.220 | 91 | 146 | .370 |
| 5 | David Ortiz | 3-0 Count | 1998 | 2016 | 402 | 65 | 445 | 16 | 27 | 8 | 0 | 6 | 18 | 0 | 0 | 380 | 0 | .415 | .915 | .815 | 1.730 | 53 | 194 | .356 |
| 6 | Jeff Bagwell | 3-0 Count | 1991 | 2005 | 382 | 62 | 430 | 18 | 31 | 6 | 0 | 11 | 28 | 1 | 0 | 367 | 0 | .500 | .928 | 1.129 | 2.057 | 70 | 132 | .392 |
| 7 | Jim Thome | 3-0 Count | 1991 | 2012 | 459 | 62 | 497 | 28 | 30 | 6 | 0 | 17 | 34 | 0 | 0 | 431 | 0 | .484 | .930 | 1.403 | 2.333 | 87 | 159 | .271 |
| 8 | Barry Bonds | 3-0 Count | 1988 | 2007 | 867 | 56 | 1088 | 22 | 22 | 7 | 0 | 10 | 33 | 0 | 0 | 1030 | 0 | .393 | .967 | 1.054 | 2.020 | 59 | 629 | .250 |
| 9 | Bernie Williams | 3-0 Count | 1991 | 2006 | 325 | 56 | 355 | 18 | 21 | 4 | 0 | 7 | 22 | 0 | 1 | 299 | 0 | .375 | .901 | .821 | 1.723 | 46 | 89 | .286 |
| 10 | Carlos Delgado | 3-0 Count | 1994 | 2009 | 378 | 54 | 425 | 15 | 21 | 4 | 0 | 12 | 33 | 0 | 0 | 369 | 0 | .389 | .922 | 1.130 | 2.052 | 61 | 173 | .214 |
| 11 | Juan Gonzalez | 3-0 Count | 1990 | 2004 | 193 | 46 | 209 | 16 | 23 | 4 | 0 | 10 | 24 | 0 | 0 | 163 | 0 | .500 | .890 | 1.239 | 2.129 | 57 | 69 | .361 |
| 12 | Lance Berkman | 3-0 Count | 1999 | 2013 | 343 | 43 | 386 | 9 | 18 | 2 | 2 | 3 | 16 | 0 | 0 | 341 | 0 | .419 | .930 | .767 | 1.697 | 33 | 152 | .357 |
| 13 | David Justice | 3-0 Count | 1989 | 2002 | 245 | 42 | 269 | 15 | 17 | 4 | 0 | 6 | 18 | 0 | 0 | 227 | 0 | .405 | .907 | .929 | 1.836 | 39 | 78 | .306 |
| 14 | Jeromy Burnitz | 3-0 Count | 1993 | 2006 | 243 | 42 | 257 | 7 | 15 | 5 | 0 | 5 | 13 | 0 | 0 | 215 | 0 | .357 | .895 | .833 | 1.728 | 35 | 67 | .270 |
| 15 | Rafael Palmeiro | 3-0 Count | 1988 | 2005 | 384 | 42 | 430 | 15 | 17 | 0 | 0 | 6 | 20 | 0 | 0 | 386 | 0 | .405 | .937 | .833 | 1.771 | 35 | 155 | .289 |
My thanks, as always, to baseball-reference.com for making available the data used to prepare this analysis.
