Kansas City’s 29-year absence from the post-season has ended with a bang. But, this is not your typical playoff team.
More after the jump.
How long has it been since the Royals were last in the post-season? Well, Calvin Klein, the Apple Macintosh and “Lifestyles of the Rich and Famous” were all the rage. And, we were just starting to learn a bit about the new top guy in the bad, old Soviet union – somebody named Gorba-something. Remember?
The big innovation in baseball 29 years ago was the extension of the league championship series from a best-of-5 to a best-of-7 affair, a change that the Royals took full advantage of, rallying from a 3-1 deficit in the ALCS to defeat an up-and-coming Toronto club. But, they didn’t stop there, also going the 7-game limit before besting the Cardinals in the World Series (with a little help from a certain umpire).
How many other clubs have gone 29 years between post-season appearances? Here are the longest droughts by franchise, since 1903.
- 42 – Browns/Orioles (first in 1944)
- 41 – Indians (1954-1995)
- 40 – Athletics (1931-1971), White Sox (1919-1959)
- 39 – Cubs (1945-1984)
- 36 – Senators/Rangers (first in 1996)
- 35 – Phillies (1915-1950)
- 34 – Braves (1914-1948)
- 33 – Pirates (1927-1960)
- 32 – Senators/Twins (1933-1965)
- 31 – Expos/Nationals (1981-2012)
- 29 – Royals (1985-2014)
- 28 – Red Sox (1918-1946)
- 26 – Brewers (1982-2008)
- 25 – Tigers (1909-1934)
- 24 – Cardinals (first in 1926)
- 22 – Blue Jays (1993 to present)
- 21 – Reds (1940-1961), Dodgers (1920-1941)
- 19 – Mariners (first in 1995), Astros (first in 1980), Angels (first in 1979), Yankees (first in 1921)
- 16 – Giants (1971-1987), Padres (first in 1984)
- 13 – Mets (1973-1986)
- 11 – Marlins (2004 to present), Rays (first in 2008), Rockies (1996-2007)
- 5 – Diamondbacks (2002-2007)
I mentioned that the Royals were not your usual playoff team. We found that out with their wild card game win. How many speedsters were they able to pluck off their bench in the late innings? It really seemed like a game from the “running wild” 1980s. But, statistically speaking, here is how the Royals ranked among 30 major league teams in these offensive categories (statistics courtesy of FanGraphs).
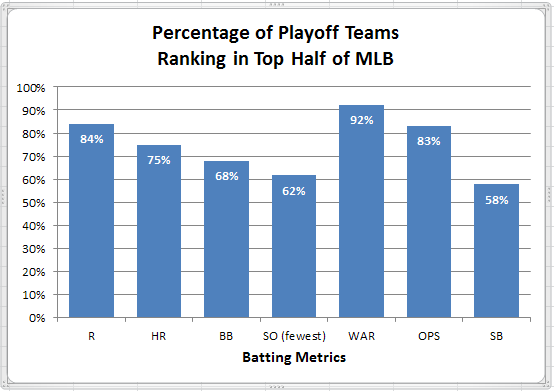
It’s probably noteworthy that there is a reasonably large difference in rankings for WAR and OPS, reflective of Kansas City’s stellar defense that has been much in evidence so far this post-season. Here is how playoff teams in general do in these metrics.
The Royals’ firsts in Stolen Bases and Strikeouts stand out, as do their lasts in Home Runs and Walks (though those four categories rank lowest in correlation to post-season qualification). What other playoff teams ranked first and last in those categories?

In addition to the Royals, only four other teams appear on even two of these lists:
- Strikeouts/Home Runs/Stolen Bases: 1959CHW
- Home Runs/Stolen Bases: 1965LAD, 1987STL
- Strikeouts/Stolen Bases: 1913NYG
The Go-Go Sox of 1959 might provide a picture of a reasonably comparable team to the Royals, though there is one significant difference. Instead of finishing last in walks, those Sox ranked 4th best in the majors in that category. That advantage for the Sox was offset by a 12th place rank (out of 16) in team BA compared to 4th of 30 for the Royals. So, different dynamics despite the similarities.
Turning to pitching, the Royals have these markers.
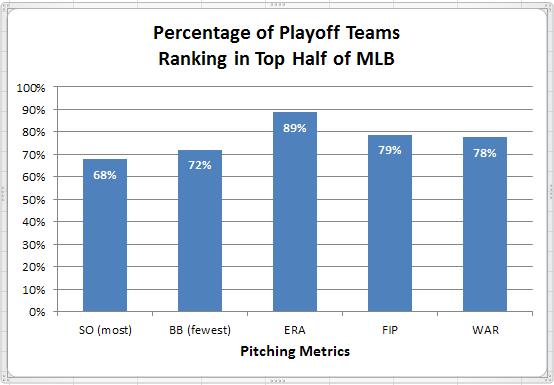
Again notable that Pitching WAR ranks considerably higher than either ERA or FIP, reflective that Kauffman Stadium provides significant advantage to hitters with an expansive outfield and limited foul territory. Here are how playoff teams have fared in these metrics.
So, possibly surprisingly, generally weaker correlation between pitching statistical leadership and post-season qualification than for batting statistical leadership. The Royals rank in (or very near) the top half in all of these categories except for strikeouts (which happens to be the metric with the lowest playoff correlation).
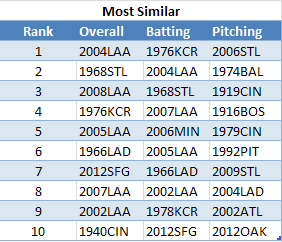
Just for fun, I came up with a list of playoff teams most and least similar to this year’s Royals. The similarity scores are based solely on similar rankings in various categories, with all rankings normalized to a 30 team MLB. The methodology was to identify teams with the smallest and largest deviations from the Royals’ rankings in these categories:
- Batting: Runs, Home Runs, Stolen Bases, Walks, Strikeouts, WAR, OPS
- Pitching: Strikeouts, Walks, ERA, FIP, WAR
The ranking differences in each metric are equally weighted, with an overall metric comprised of the sum of the average ranking differences for the batting and pitching metrics. As I say, a fun metric that yields these results.
Kind of nice that this year’s Royals are a throwback to their 1970s brethren. And, encouraging to their fans that half of the most similar overall were pennant winners, with four of those five taking the WS crown. Also interesting that World Series opponents appear in the Most and Least Similar lists for 1940 and 1968.


