A new tool in the Baseball-Reference Play Index allows analysis of player and team performance over any contiguous portion of a season, bounded by team game numbers. Thus, with every team having played at least 149 games as of Sep 15th, here is how this year’s playoff contenders have fared over the twenty games from 130 to 149.
| Rk | Tm | Record |
|---|---|---|
| 1 | LAA | 16-4 |
| 2 | BAL | 15-5 |
| 3 | SFG | 13-7 |
| 4 | LAD | 13-7 |
| 5 | DET | 13-7 |
| 6 | STL | 12-8 |
| 7 | PIT | 12-8 |
| 8 | WSN | 11-9 |
| 9 | TOR | 11-9 |
| 10 | CLE | 10-10 |
| 11 | SEA | 9-11 |
| 12 | KCR | 9-11 |
| 13 | NYY | 8-12 |
| 14 | OAK | 7-13 |
| 15 | ATL | 7-13 |
| 16 | MIL | 6-14 |
How have past playoff teams fared going down the stretch? Do hot teams stay hot, or does just making the playoffs render a team vulnerable to an October letdown? Are teams which clinch early better advised to coast down the stretch, or keep the pedal to the metal? More after the jump.
For this analysis, I’m looking at performance in the playoff stretch since multi-round playoffs were introduced in 1969. For stretch, I’m looking at approximately the last 30 games of the season, approximately because teams don’t always play exactly the same number of games. Appropriate allowances have been made for the strike-shortened seasons in 1972, 1981 and 1995,
Here are the season winning percentages for all playoff teams, before and during the stretch drive.
Thus, while almost 3/4 of playoff teams play under .600 ball through August, over half (55%) of those same teams will turn in a .600 or better September. Thus, teams below the 12-8 mark so far in this year’s pennant chase will likely have to turn it up a notch (or several notches) if they have serious October aspirations.
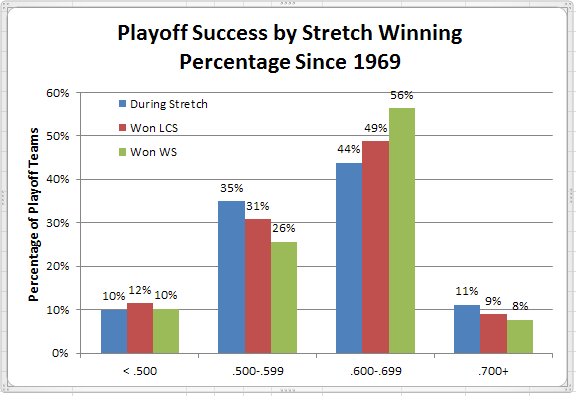
Delving a bit further, the chart below shows how playoff teams fared based on their stretch drive winning percentages. The brown bars should be read as “x% of LCS winners had the indicated stretch drive winning percentage”.
Mostly in line with the proportion of playoff teams, but with a slight bias towards the teams which finished stronger as 58% of LCS winners finished at a .600 or better clip, compared to 55% of playoff teams overall. That bias grows stronger when looking only at World Series winners, as shown below, with now 64% of WS winners finishing at that same .600+ clip.
Note that finishing below .500 or above .700 does not seem a good predictor for playoff success in that the representation of those teams among League and WS champions is about the same as their representation among all playoff teams. Probably that is because playing that well or poorly is likely not indicative of the team’s true performance, and thus unlikely to continue to be maintained into and through the playoffs.
But, before reaching the conclusion that teams must finish strong to have a good shot at playoff glory, let’s first consider the context of “finishing strong”. As in, strong compared to what. As was shown in the first chart, there’s a big difference in playoff team winning percentage before and during the stretch drive. Plotting those winning percentages produces this chart.
The horizontal axis shows the winning percentage before the stretch drive, while the vertical axis shows the change in that winning percentage during the pennant chase. So, teams have improved or regressed in winning percentage by up to 300 points or so with, predictably, the largest stretch drive improvements seen in teams with lower winning percentages before September and, conversely, the largest regressions seen in teams with higher winning percentages before the stretch run. For example, this chart shows that all playoff teams that improved their winning percentage by 200+ points were under .600 before the stretch, and that all playoff teams that regressed by 200+ points were above .600 before September.
I’ve highlighted the area with a pre-stretch winning percentage between .550 and .650 and a stretch drive change between -100 and +100 points. These are the solid clubs that maintained a winning percentage during the stretch drive close to what it was before. The highlighted area comprises a goodly proportion of all playoff teams, though there is a sizable number of teams outside that box, particularly above and to its left, indicating teams below .550 before September and/or which added 100+ points to their stretch drive winning percentage.
But, look what happens when the playoff teams that do not win pennants are removed.
A large proportion of those teams above and to the left of the highlighted area are now gone. Even the ones that remain are tightly clustered near that box. Conversely, a considerably lower proportion of the other outliers (those below and to the right) have disappeared. Thus, the weaker outlying teams seldom win pennants regardless of how strong they finish, while the stronger ones still have a reasonable shot, even when they cool off coming down the stretch.
The best predictor, then, of a team’s playoff success is not how it did in the last month of the season, but how it did overall. So, enjoy the scramble for the wild card berths; it is great stuff to watch. But, when late October rolls around, chances are we’ll be seeing the teams that have performed the best all season long and (as was shown in the first list) are maintaining that consistent performance in September. Mostly, those teams will be locking up their playoff berths this week, instead of doing so in a dramatic scramble to the wire that we’ll be seeing next week.


