How is WAR contributed by major league pitchers? At what age do pitchers become most valuable to a team? I’ll be looking at those question in response to a suggestion by mosc, a regular and thoughtful contributor to our discussions here at HHS.
More after the jump.
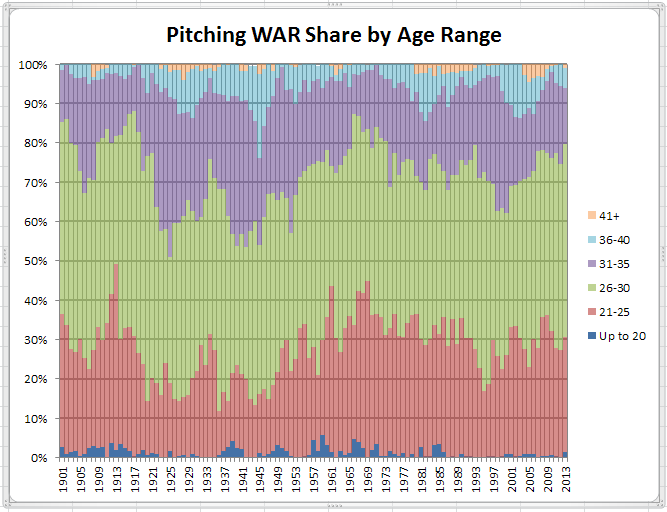
To investigate those questions, I’ve captured total FanGraphs WAR by Age for each season since 1901. Here is how WAR has been shared by age since 1901.
Obviously some variation over the years, but more consistent for the post-war period when, with few exceptions, there has been at least 20% of WAR from 25 and under pitchers, at least 70% from those 30 and under, and at least 90% from everyone 35 and younger. Looking at the present period, it’s worth noting that, for the first time in 40 years, there have been 7 consecutive seasons with 75% of WAR coming from pitchers aged 30 and younger.
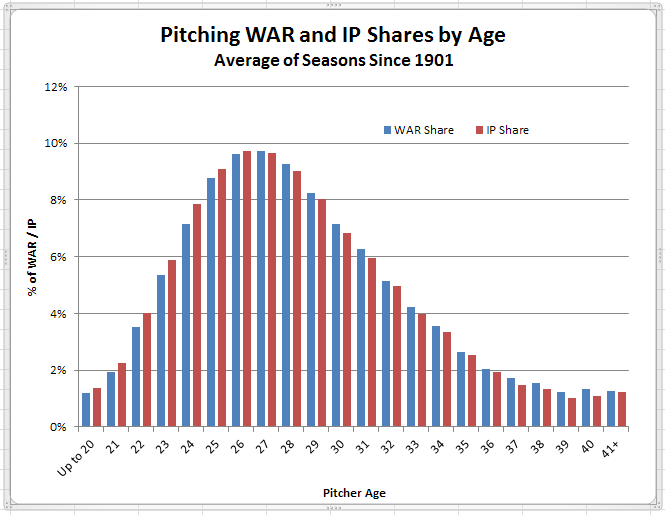
But how does the share of WAR by pitcher age compare to share of innings pitched by age? Those two quantities are illustrated below.
They track closely because, regardless of age, there is a standard that major league pitchers must attain. And, it can be a very small difference between that standard and stardom or, conversely, between the standard and obscurity. We’ve all seen it – a pitchers loses a bit off his fastball or his slider doesn’t have quite the bite it once had and last year’s All-Star is suddenly back in the minors.
That said, while the WAR and IP shares are quite close, they aren’t identical. And, if you look closely, you’ll see that the IP Share bars are higher for the younger ages while the WAR Share bars are higher for the older ages. It’s that difference that I want to study. To do so, I’ve derived the metric WAR Contribution as:
Thus, WAR Contribution, when calculated for each age, shows in percentage terms how much more or less WAR value was contributed by pitchers of that age relative to their share of innings pitched. A negative value means those pitchers had a lower proportion of WAR than of IP. Positive means the opposite.
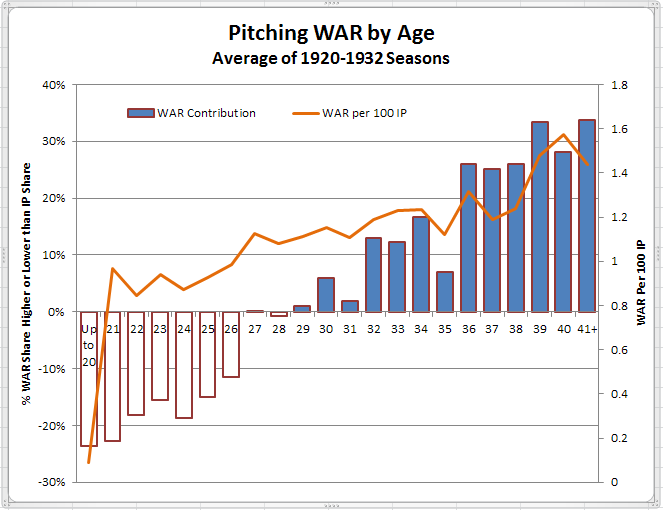
Here’s what those result looks like, shown as vertical bars, with an overlay of the WAR per 100 IP for each age.
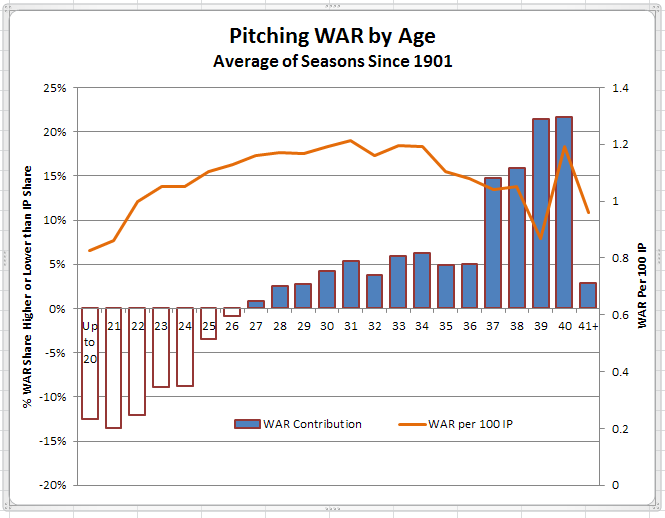 What are these results telling us? First, as with many investments, patience will be needed before young pitchers start to return positive dividends. But, once they do, those returns continue to grow through most of the rest of the pitchers’ career. Looking at the WAR per 100 IP line shows a value between 1.0 and 1.2 for most of a pitcher’s career, translating into a range of 2.0 to 2.4 WAR for the average pitcher in a 200 IP season.
Why is there such a big move up in WAR Contribution with pitchers in their late 30s? Intuitively, one might think the returns would diminish as pitcher performance declines with advancing years. What is happening, though, is selection bias. What I mean by that is that, as pitchers age, their “replacement level” rises. For example, a team may give 150 innings to a 22 year-old with a 5.78 ERA because it’s an investment in the future returns from that pitcher. There won’t be the same tolerance for a 37 year-old with that ERA who will be judged as not having positive future returns and will thus be replaced before he can accumulate those kind of innings. Thus, as pitcher age advances, and especially with the older ages, the bulk of the innings will be contributed by smaller numbers of mostly better pitchers.
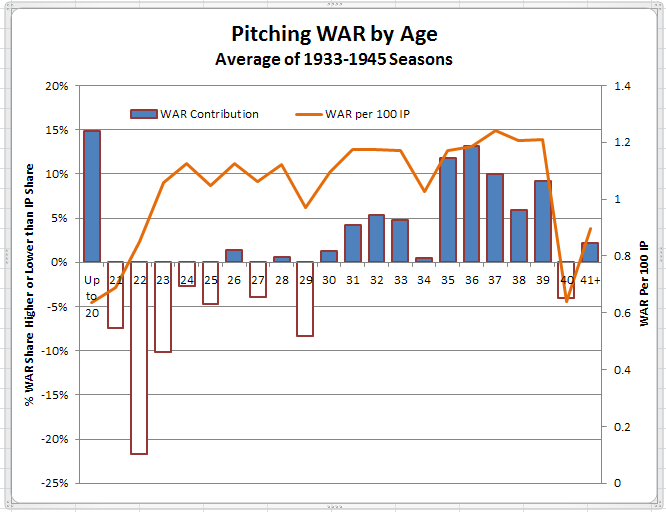
Here are the same results, broken into different eras. Because we are looking at shorter time periods, there is more susceptibility to distortions at the margins due to representation of small numbers of pitchers and, thus, small proportions of IP. When the IP Share number is small, even small differences between it and the WAR Share number can result in big differences in WAR contribution, a mostly illusory result. With that caveat:
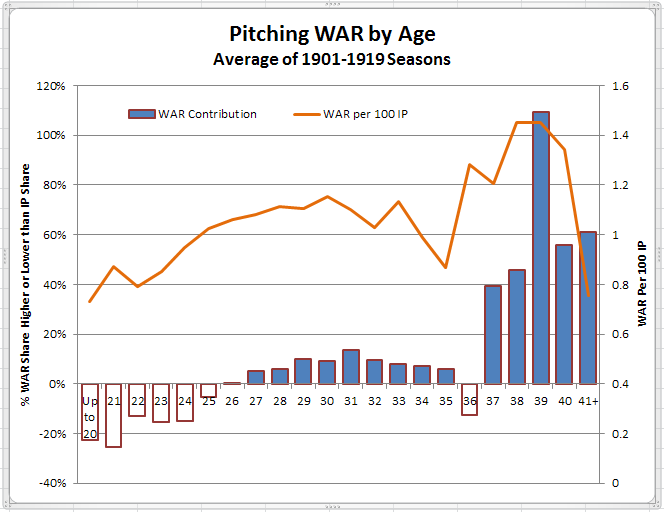
The dead ball era shows fairly consistent results with the overall pattern. The dip at age 36 is most likely anomalous.
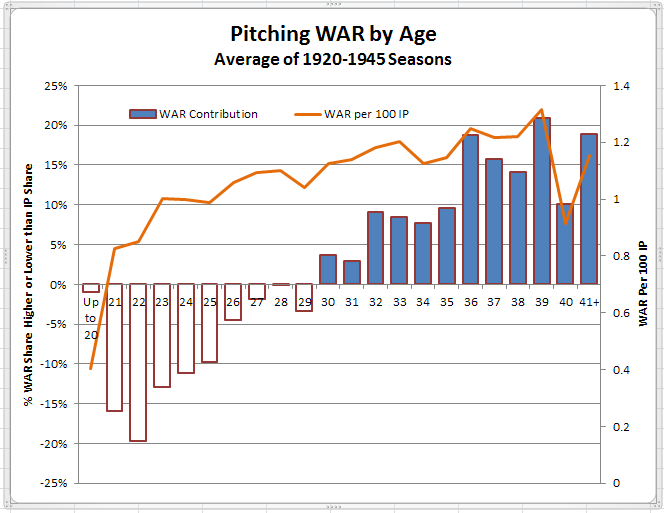
Younger pitchers had particular difficulty facing the heavy hitters of the 1920s and 1930s, with positive results not being seen until age 30. While WAR results are normalized to the era, thinking in human terms, it was probably harder for young pitchers in this era if only because of the psychological effects of being pounded on by the likes of Ruth, Gehrig, Foxx, Greenberg and so many others.
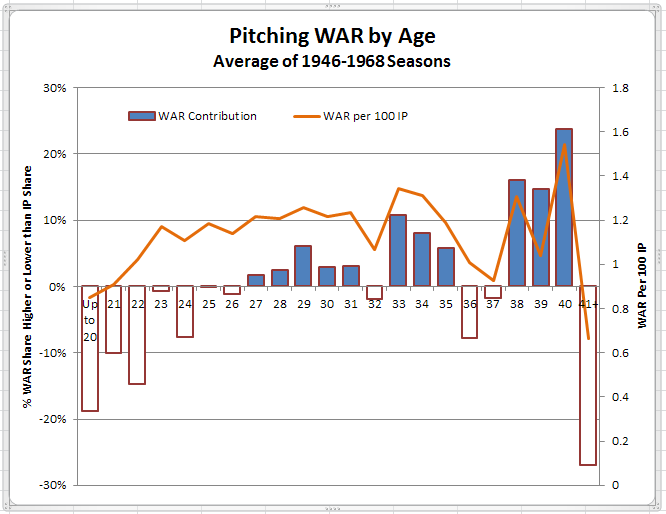
A return to a more normal pattern with positive WAR contribution starting in the mid-20s and reduced contribution levels for older pitchers. Pattern breaks may possibly be related to the juxtaposition of a high offensive era starting around 1950 and a low offensive era over the last 5 or 6 years of this period.
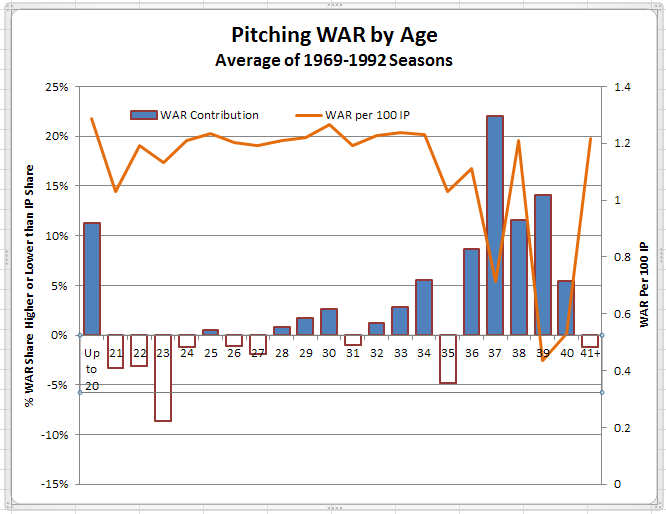
Coming out of the bonus baby era, this period shows consistent WAR per 100 IP starting from the early 20s, probably the result of earlier application of selection bias in that only the very best pitchers are being given significant innings at a very early age, and few young pitchers get significant innings until “they’re ready”.
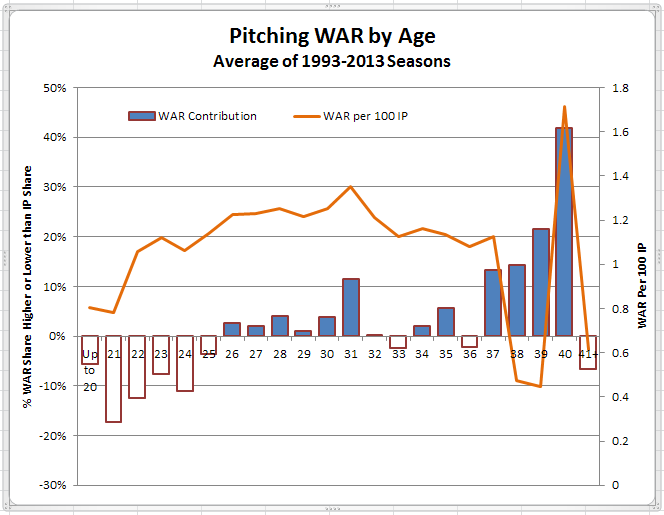
This period “reverses” to some extent the selection bias at young ages seen in the preceding period in that young pitchers of all ability levels begin seeing their innings “managed” so that their workloads are now “artificially” controlled rather than being primarily dictated by ability levels. The result is a return of increasing WAR per 100 IP through the early 20s.
What may not be immediately evident from the above charts becomes clearer in the chart below.
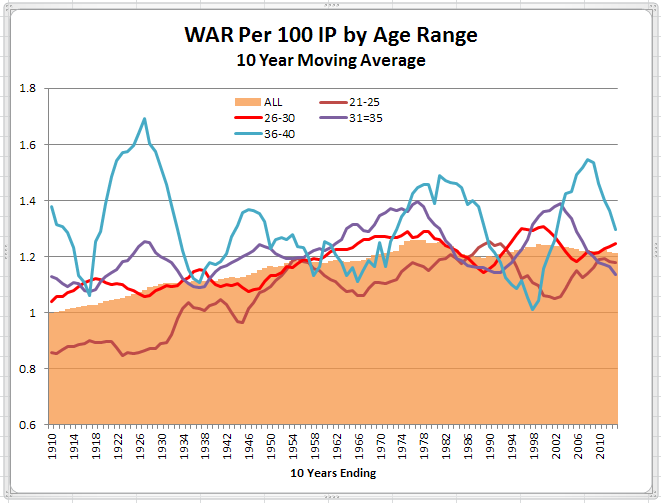
Sharing innings among more pitchers does yield improved pitching results overall. However, there can be too much of a good thing as that steady improvement in overall WAR per 100 IP has leveled off and even declined slightly since the late 1970s. What has driven this improvement? It would seem that has occurred primarily because of improved results for younger pitchers, probably due to some combination of more sophisticated player development and a more cautious approach to workload for those pitchers.
It may be worth noting that the trend lines for the different age categories are presently converging at about the 1.2 WAR per 100 IP level. That convergence was previously seen only in the mid-1950s and early 1990s. Presumably that would indicate optimal selection bias for pitchers of all ages in that there is a uniform level of pitching quality regardless of a pitcher’s age. Whether it really means that I will leave to your astute judgment.

