Great teams require great players. Sounds simple. But, how do you get those great players?
Historically, with teams essentially owning their players for life (if the team chose to) the answer was to find and develop the star talent you would need to win a championship. But, has that formula changed with the advent (and now maturity) of free agency?
More after the jump.
This post looks at each franchise’s top 10 position players and top 10 pitchers, both measured by WAR produced by those player for that franchise since 1901. With those players identified, their WAR is separated into two categories based on whether that player debuted in the majors with that team (“homegrown” WAR), or with another team (“acquired” WAR).
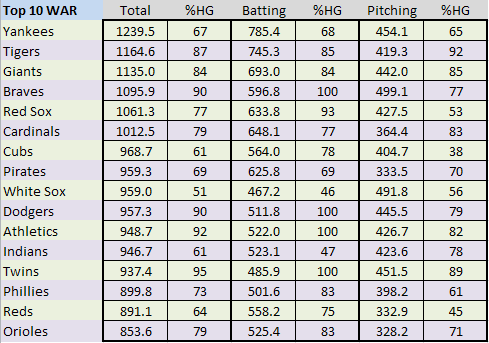
Confused? A picture’s worth a thousand words. Here’s a summary of the original 16 teams, ordered by the total WAR (batting and pitching) produced for each franchise by its top 10 position players and top 10 pitchers.
Not surprisingly, the Yankees top the list in total WAR and Batting WAR, and are third (to the Braves and White Sox) in pitching WAR. And, they were consistent, in both batting and pitching, in how they found their top 10 players, about two-thirds homegrown (HG) and one-third acquired from other teams.
That two-thirds HG rate, though, is on the low end of the scale with only the Cubs, White Sox and Reds posting a lower Total HG mark than the Yankees. That three of those four teams represent America’s two largest cities may not be a coincidence – large market teams, typically on more solid financial footing, often can more easily fill talent gaps with acquisitions from other teams.
HG scores for batters are generally higher than for pitchers. Part of the reason for that is having 10 players for each group, which “over-represents” pitchers in this study relative to hitters. Another part is that many pitchers generally take longer to develop into major WAR contributors, more time than some teams are willing to give their young arms. The result is that pitchers some teams give up on can later become stars on other teams.
Notwithstanding that HG scores are generally higher for hitters than for pitchers, most teams had HG scores that were “fairly” similar (within ~20 percentage points) for both. Exceptions include the Cubs (78/38), Red Sox (93/53), Indians (47/78) and Reds (75/45). Again, possibly not a coincidence that the Cubs and Red Sox have so much lower scores for pitchers than for hitters – pitching effectively in a tough pitcher’s park can be difficult for young pitchers forcing those teams to go more to veterans with the maturity to handle adversity.
The Twins have the highest HG scores on the board. That has recently been driven by economic necessity but, even before moving to Minnesota, the Senators had a penchant for sticking with their own players. Other smaller market teams (Athletics, Braves) also have higher HG scores, a pattern that persists among certain expansion teams.
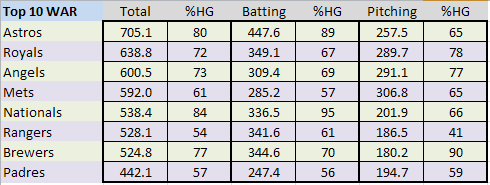
Speaking of which, here are those expansion clubs, first for the initial expansion wave prior to the start of free agency.
Again ordered by total WAR, the Astros rank first overall, and first by a huge margin in batting WAR. At the other end of things are the Padres, in last place and nowhere near next to last. HG scores are lower overall than for the original 16 clubs, with higher scores in smaller markets (Nationals, Brewers) again evident. The Brewers, though, still produced the lowest pitching WAR in this group despite having the highest pitching HG score. Another small market team (Kansas City) that relies on home-grown talent has had mixed success in doing so with good effect as evidenced by their middle-of-the-pack HG scores.
Has there been much change with the most recent group of expansion teams?

Mariners have the edge in hitting WAR and the Blue Jays in pitching. Overall HG scores are lower still than previous groups, with the Blue Jays leading in %HG, and with similar scores for hitters and pitchers. The Rockies have the edge over the Marlins in hitting WAR with both having equally inferior pitching WAR totals. Rays have the edge over the D-Backs in hitting and vice-versa in pitching, with Arizona’s low HG score for pitching WAR primarily attributable to two dominant pitchers (I’m sure you know them) who were instrumental in the 2001 championship season.
That’s the summary view. Here are the details, showing the top 10 WAR-producing hitters and pitchers for each team. You can scroll through the table, team by team, or type a team nickname in the search box to bring up that club. Individual players can also be searched for in the same way. WAR is shown as homegrown (HG) if the player had his major league debut for that franchise, and as acquired (ACQ) if not. All career WAR produced for the franchise since 1901 is shown, even if accumulated over multiple stints with the club.
First for the original AL clubs.
[table id=217 /]
.
The original NL clubs.
[table id=218 /]
.
First expansion wave.
[table id=213 /]
.
Second expansion wave.
[table id=214 /]
.
Some notes:
Most appearances:
3 – Nolan Ryan, Roger Clemens, Alex Rodriguez
2 – Pete Alexander, Carlos Beltran, Bert Blyleven, Barry Bonds, Kevin Brown, Eddie Collins, Tom Glavine, Bobby Grich, Lefty Grove, Vladimir Guerrero, Tim Hudson, Fergie Jenkins, Randy Johnson, Mark Langston, Greg Maddux, Pedro Martinez, Jon Matlack, Joe Morgan, Mike Mussina, John Olerud, Gaylord Perry, Curt Schilling, Tris Speaker, Larry Walker
Most first place appearances:
2 – Randy Johnson (for now; King Felix will pass Johnson on the Mariner list very shortly)
Conclusions
Unsurprisingly, hanging onto players for extended periods has become harder and harder, as evidenced by declining HG scores for the expansion teams compared to the original clubs. But, even among the latter, the bulk of the top 10 positions are held by players from before free agency.
So, should teams just go shopping and stop trying to develop talent? The answer, of course, is no, if only for economic reasons. The best bang for the buck comes, without question, from filling a lineup with capable young players, most of which have to come from within.
But, the results of teams which do hang onto their talent (despite the challenges) also support the importance of developing and retaining talent. Exhibit 1 are the Braves who, while snakebit in the playoffs, have been contenders, season in and season out, for over 20 years. Exhibit 2 would be the Rays, who have been to a World Series and frequently contended in recent seasons, doing so with a solid core of homegrown talent.
And the teams that don’t do a good job of developing and retaining talent? Check out the low HG scores for the D-backs, Padres, Rockies, Marlins, Rangers, Mets, Cubs and White Sox. While each has had occasional success (such as recently for the Rangers), mostly their performance has been mediocre.
Finally, what about the Yankees? The Yankees have the financial wherewithal most teams can only dream of, but while out-spending everyone else has made them perennial contenders, one world championship in 12 years is a major drought by Yankee standards. Not a model for others to follow, even if they could afford to.


