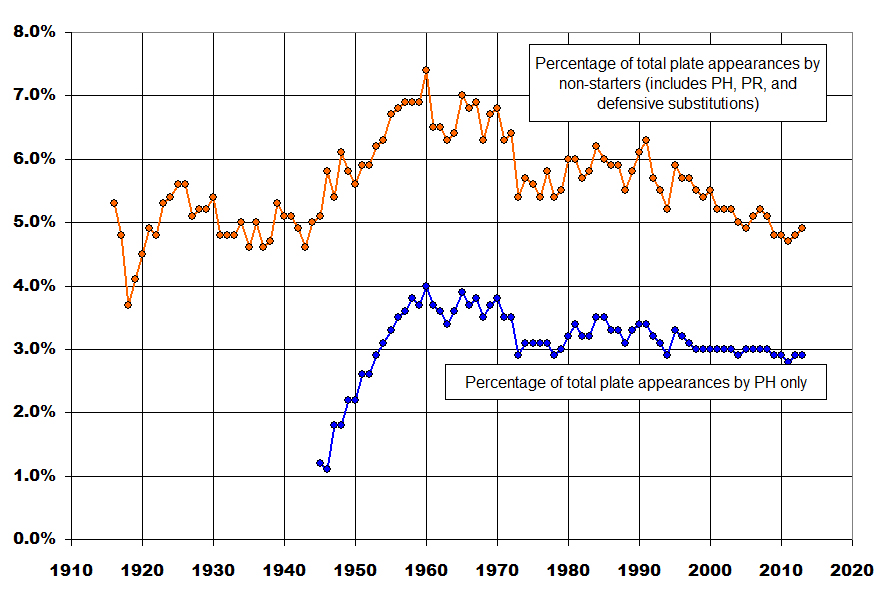
Here’s a simple plot showing, by year, the percentage of all plate appearances given each year to any non-starter, as well as the percentage given to pinch-hitters specifically.
The pinch-hitter data goes back only to 1945 (the limit of full play-by-play availability) and happens to coincide with a dramatic increase in the use of the pinch-hitter in baseball. From 1945 until 1960, nearly 3% more of all plate appearances went to pinch-hitters, singlehandedly accounting for the same increase among all non-starters.
Since that time, pinch-hitter use has tapered off slowly, falling about 1 percentage point over the 50 or so intervening years, while overall non-starter plate appearances have dropped by more than double that amount. The reason is likely a drop in defensive substitutions. It’s clear that defense is better now than ever and fewer teams carry defensive specialists, instead opting in most cases to keep good reserve bats on the bench. The effect may also be due to the overall emphasis on offense, with teams seemingly more likely to keep a good player in the game because of his bat, rather than removing him for a better glove man.

