This post looks at the distribution of standout position players across decades, both Hall of Famers and others. The seed was birtelcom’s recent “Hall of Famers by Final Year in the Majors,” and more precisely, from an exchange we had in those comments, which I’ll summarize (with apology for any loss of context to birtelcom’s quote):
- John: The number of teams has grown from 16 to 30 since 1961, so you’d expect eventually to see more HOFers per decade in the post-expansion era.
- Birtelcom: Just because you have more teams doesn’t necessarily mean you get more of the greatest players.
From one angle, I see his point: If we could define greatness in absolute terms, without reference to their particular era, then they might be quite unevenly distributed across decades.
But is an absolute, context-free ranking even possible? Can you make an absolute comparison between Frankie Frisch and Bobby Grich? Between Sam Rice and Jim Rice? Or even Pudge Fisk and Pudge Rodriguez?
I can’t do it. Instead, I’ll use Wins Above Replacement, a relative measure that gauges a player against his contemporaries. We still might find greatness unevenly distributed across decades. But let’s see.
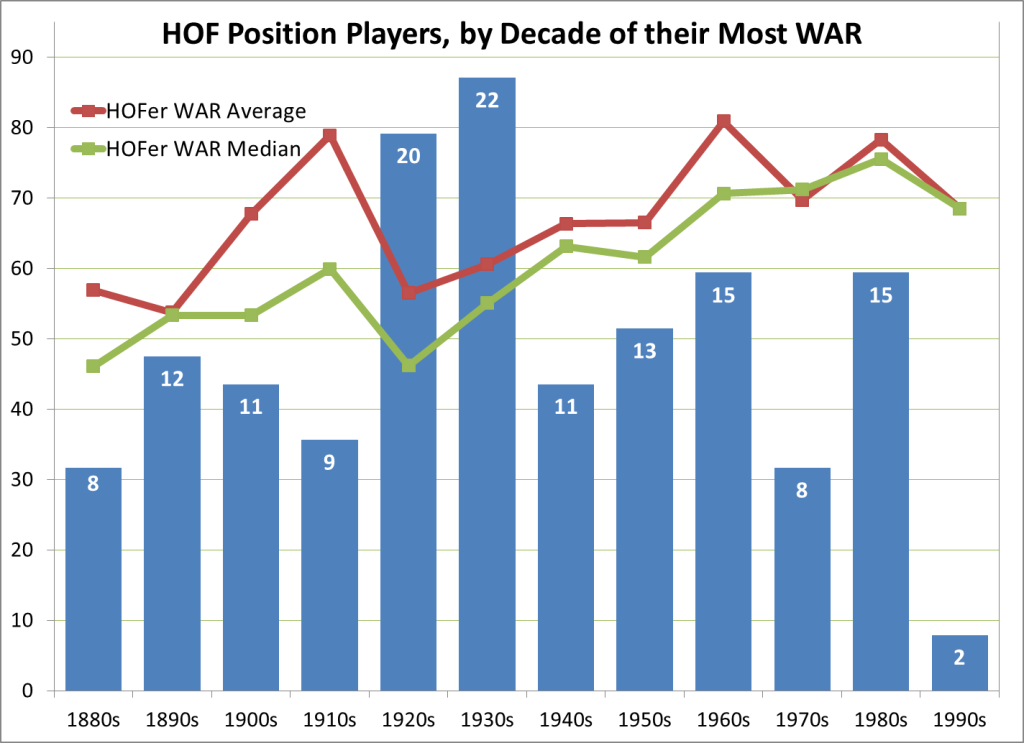
We’ll start with the Hall of Famers. This graph shows the number of HOFers by decade (the blue bars), based on the decade in which they compiled their most WAR. The red and green lines show the average and median WAR for each decade’s HOFers.
Note: All players referenced in this post are HOF-eligible and have been on the ballot at least once. HOFers referenced are those elected on the basis of their MLB playing careers.
This was to show that the distribution of HOFers is uneven, and not reflective of league size. Ignoring the 1990s — as I generally will in this post, since many standouts of that era have been on the ballot just briefly, while some others have been voted down due to known or suspected use of performance-enhancing drugs — what’s most striking at first glance are the HOF spikes in the 1920s and ’30s, which don’t seem supported by the WAR numbers of those groups. There’s also a big dip in the 1970s, which had 50% more teams than the pre-expansion era.
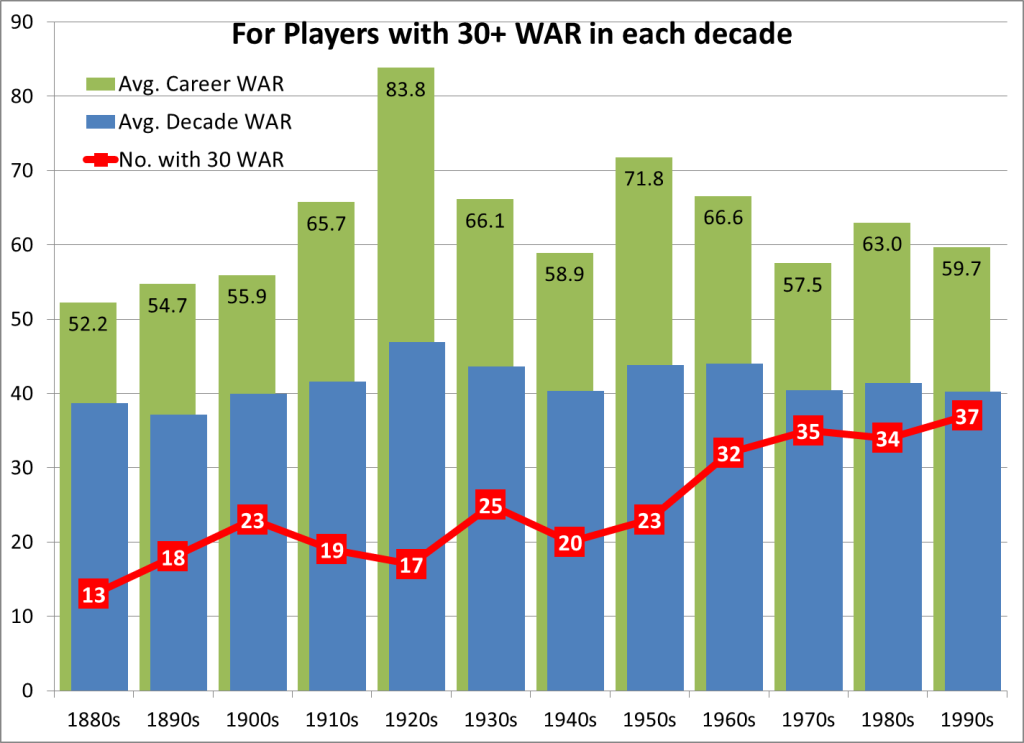
How do those HOF numbers stack up against the pool of outstanding players in each decade? The next graph shows the number who compiled 30+ WAR in each decade (the red line), plus their average WAR in that decade (blue bars), and their average career WAR (green bars). Players are counted in each decade in which they reached 30 WAR:
By this measure, having more teams does correlate with having more outstanding players. The expansion era has far more players reaching 30 WAR in each decade, while their average WAR for career and for decade are consistent with most prior decades.
(The career WAR spike in the ’20s comes from six inner-circle HOFers — six of the top 13 position-player WAR totals — which are averaged across a low count of 17 players with 30+ WAR in that decade. The median for the ’20s is 68.6, much more in line with the norm.)
I don’t mean to imply that 30 WAR in a decade is a HOF litmus test. Some 268 players had at least one 30-WAR decade, while the Hall numbers 146 position players. I chose 30 WAR as a round number which was attained (a) by about 3/4 of all HOFers at least once, and (b) by from one to 1.5 players per team per decade.
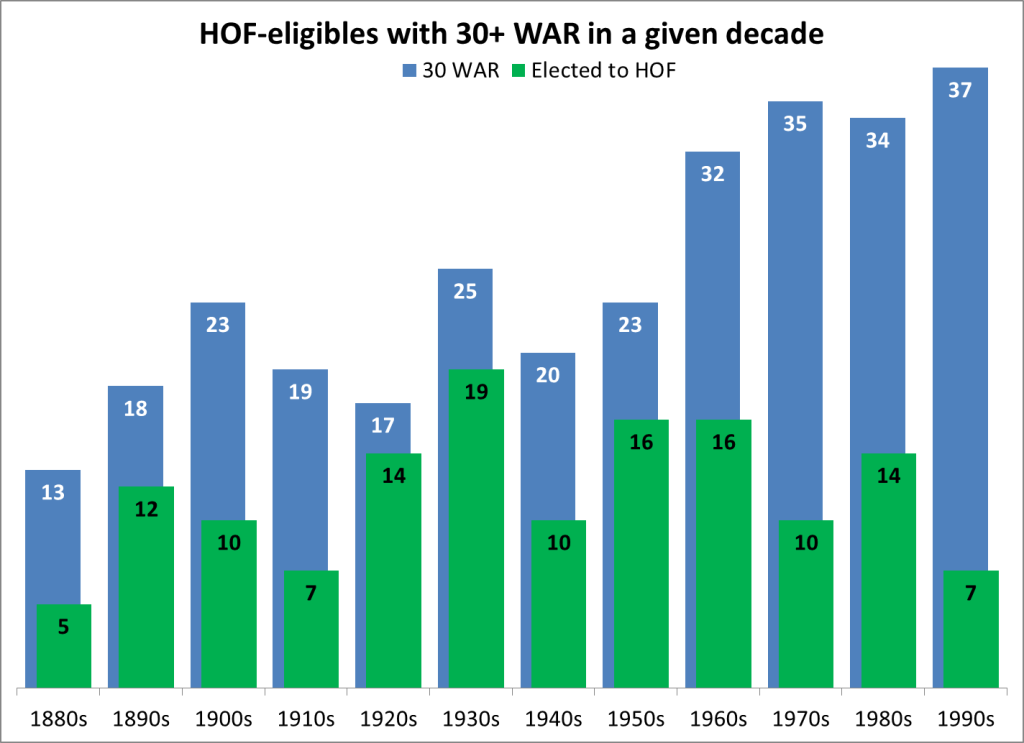
Anyway … The tally of 30-WAR players goes up in the expansion decades, but fewer of them are elected to the Hall:
Comparing eras:
- Pre-expansion, 59% of 30-WAR decades led to HOF election.
- For the 1960s-80s, it’s 40%.
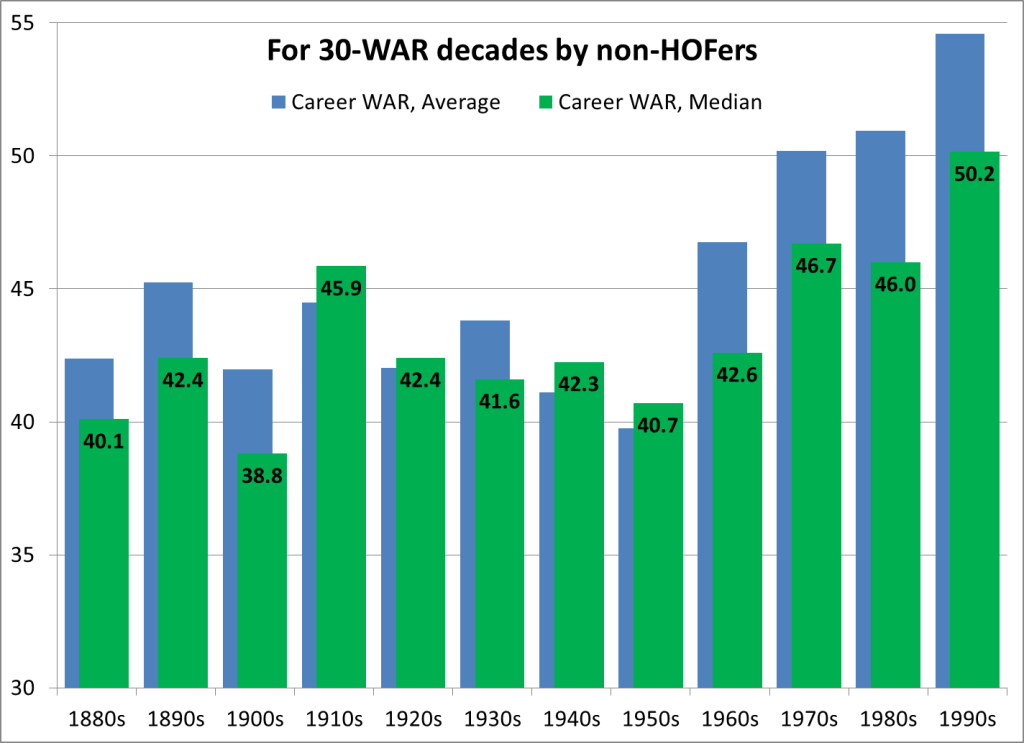
But maybe the expansion-era non-HOFers just didn’t pack enough extra WAR around their 30-WAR decade to merit a Hall nod. Let’s see the career figures for non-HOFers with 30-WAR decades. How do the expansion-era unelecteds stack up to their predecessors? Pretty favorably:
Both the average and median for each expansion decade is higher than any pre-expansion decade except the 1910s.
Still, none of this really proves that there have been more truly deserving players left out of the Hall in the expansion era than in prior decades. Perhaps the lower rates of election mostly reflects fewer bad choices; few of us want the Hall defined by its worst players. In the next passage, I’ll introduce a simple WAR standard that I think roughly picks out the upper half of HOF inductees. I hope you’ll bear with me.
The “54/27 WAR” Standard
The Hall of Fame currently holds 146 position players who were elected on the basis of their MLB careers. Sixty-one percent have at least 54 Wins Above Replacement (89/146). Sixty-four percent averaged at least 27 WAR per 1,000 games played (94/146). And exactly half meet both standards, 54 WAR total and 27 WAR/1,000 G.
The 54/27 WAR standard is not highly scientific; it’s just a simple attempt to balance WAR totals and rates in a measure that would define noncontroversial HOF selections. I looked for whole numbers where (a) about two-thirds of HOFers would meet each threshold individually, and (b) about half would meet both. And 54/27 works for that. The 2-to-1 ratio, and the fact that both numbers are evenly divisible by nine, are just happy accidents.
There’s no consensus on the right size of the Hall, and most folks will agree that the Hall has made some mistakes. But this paired standard, 54 WAR total and 27 WAR/1,000 G, roughly defines the upper half of HOF position players, numbering 73. There is little debate on their worthiness. (For example, they’re all in the Hall of Stats save Billy Herman, and he’s right on the cusp, with a 99 Hall Rating.) So the 54/27 standard has some credence as a threshold for “clear Hall of Famer.”
Well, then: There are 27 more HOF-eligible position players who meet the 54/27 standard, but have been rejected at least once by the voters. A few of those are in PED purgatory. A few are recent players who failed on early ballots but still could get in. But most are simply underrated, for one reason or another.
Again, it’s pure coincidence that 73 + 27 makes exactly 100 HOF-eligibles who meet the 54/27 standard. Incidentally, all of them had at least one 30-WAR decade except Jim Wynn, who peaked at 28.9.
The 27 unelecteds averaged virtually the same career games as the overall HOF population, while slightly besting them in career OPS+, WAR and WAR/1,000 G. If we remove Barry Bonds, the remaining 26 averaged the same 128 OPS+ as the HOFers, with slightly more WAR/1,000 and slightly less total WAR.
I am not making a Hall of Fame plea on their behalf — no, not even though three of the 27 are 1980s Tigers. I just want to look at the distribution of these Hall snubs by decade.
Here is a breakdown of those 27 unelected players by the decade in which they amassed the most WAR; decades not listed had none:
- Pre-expansion: 4
- Expansion era: 23
- 1880s: 1 (Jack Glasscock)
- 1890s: 1 (Bill Dahlen)
- 1910s: 1 (Sherry Magee)
- 1930s: 1 (Bob Johnson)
- 1960s: 3 (Ken Boyer, Dick Allen, Jim Wynn)
- 1970s: 4 (Bobby Bonds, Sal Bando, Bobby Grich, Reggie Smith)
- 1980s: 7 (Alan Trammell, Tim Raines, Lou Whitaker, Keith Hernandez, Willie Randolph, Chet Lemon, Buddy Bell)
- 1990s: 9 (Barry Bonds, Jeff Bagwell, Edgar Martinez, Larry Walker, Kenny Lofton, Mark McGwire, Robin Ventura, Mike Piazza, Will Clark)
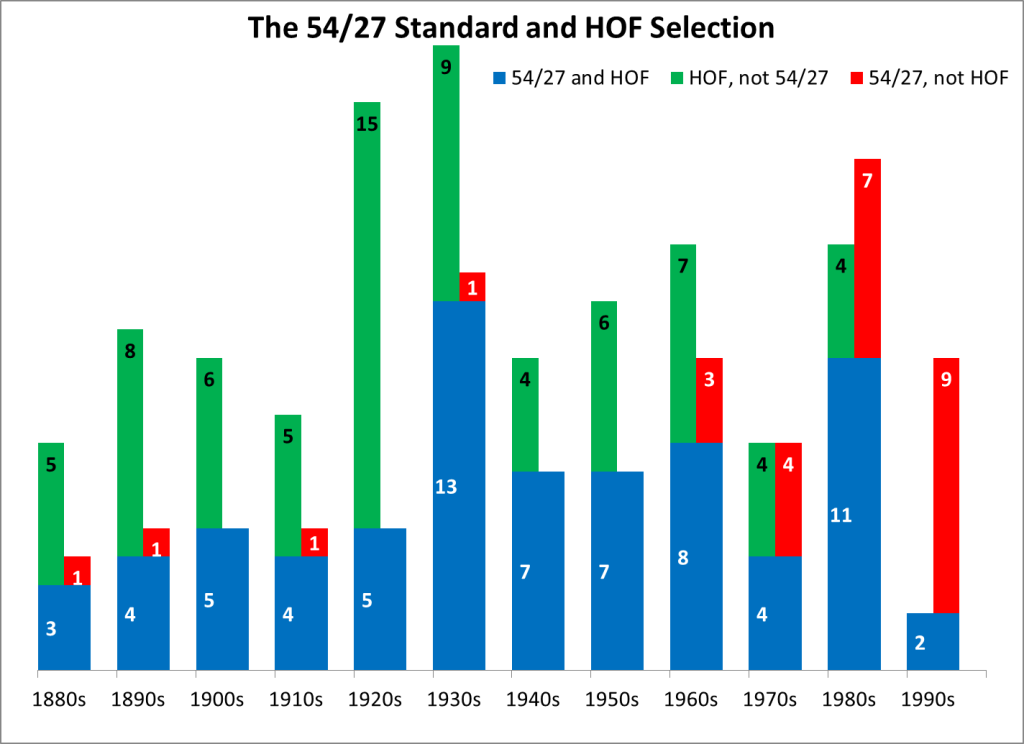
The next graph shows three things, grouped by the decade of a player’s most WAR: HOFers who meet the 54/27 standard (blue base); additional HOFers who fail the 54/27 standard (green branch); and those who meet 54/27 but are not in the Hall (red branch):
Comparing eras:
- Pre-expansion, 92% of the 54/27 players were elected (48 of 52); for the 1960s-80s, 62% (23 of 37).
- Pre-expansion, only 45% of HOFers met 54/27; for the 1960s-80s, 61% (23 of 38).
The disparity is greatest in the 1980s: 11 of 15 HOFers (73%) do meet the 54/27 standard, while 7 of 18 meeting 54/27 have not been inducted (39%). Both rates are higher than any prior decade.
Conclusion
These WAR-based studies suggest that:
- Outstanding players are pretty evenly distributed across decades, if you adjust for expansion; and
- The Hall of Fame has not adequately adjusted for expansion.
I’m not suggesting that a bunch of expansion-era stars should be voted in, willy-nilly, just as soon as possible. But I do think every Hall of Fame voter should know about this imbalance.
Thank you for reading, and please be sure to sign the guest book below!

