 HHS reader Jacob identified that Zack Cozart is currently leading the NL in both sacrifice hits (i.e. sacrifice bunts) and sacrifice flies. Should Cozart still have the same standing at the end of the season, he would become the first player since the sac fly was first officially recorded in 1954 to lead his league in both categories in the same season. Not only that, he would become just the fifth player to lead in both categories at any point in a career.
More on sacrifice hitting after the jump.
First, let’s look at sacrifice bunts. These have been recorded in the AL since its inception in 1901, and in the NL since 1894, the year after the pitching rubber was moved to its current distance of 60 feet 6 inches from home plate.
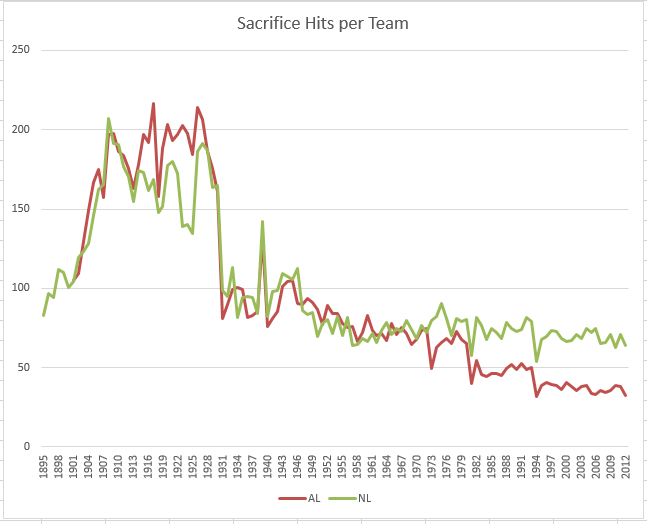
Not surprisingly. the sac bunt had its heyday in the dead-ball era, emphasized by Ray Chapman‘s record total of 67 sac bunts while batting 2nd for the 1917 Indians. With the advent of the live-ball era in 1920 and excepting a brief uptick in the run-starved wartime years, sac bunts declined steadily, even during the so-called second dead-ball era in the late 1960s. (Note that the numbers prior to the 1930s are somewhat inflated as, at various time, sacrifice hits included what we now call sacrifice flies, as well as fly outs that advanced a runner to any base.)
There was a brief uptick in both leagues with the advent of the 1970s running game, but the downward trend has continued since, more steeply in the AL reflecting a continuation of the league divergence resulting, not unexpectedly, from the introduction of the DH rule.
These are the players who have most often led their league in sacrifice hits.
| Player | AL | NL | Total |
| Mule Haas | 6 | 6 | |
| Juan Pierre | 1 | 3 | 4 |
| Omar Vizquel | 3 | 1 | 4 |
| Otto Knabe | 4 | 4 | |
| Phil Rizzuto | 4 | 4 | |
| Bert Campaneris | 3 | 3 | |
| Bucky Harris | 3 | 3 | |
| Craig Reynolds | 3 | 3 | |
| Marty Barrett | 3 | 3 | |
| Ray Chapman | 3 | 3 |
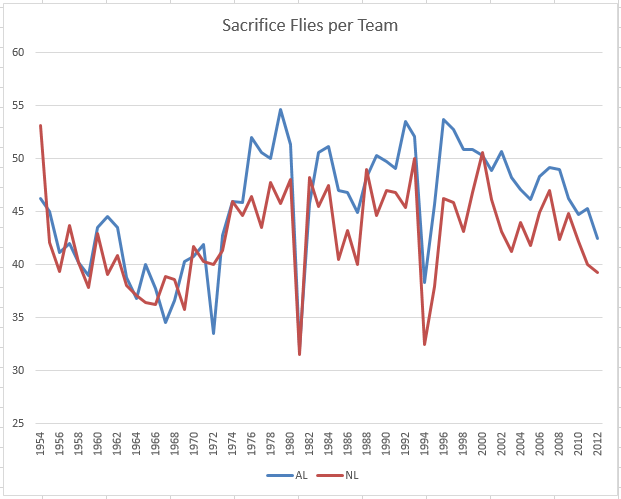
As mentioned above, sacrifice flies were, at various times, counted among sacrifice hits, but have been counted separately in both leagues since 1954. Here are those trends.
After declining through the 1950s and 1960s, there was a noticeable jump in the 1970s after which the trend is fairly constant until declining over the past decade. The league divergence in sacrifice hits resulting from the DH rule is also evident here, with significantly more sacrifice flies for AL teams.
These are the batters who have most often led their league in sacrifice flies.
| Player |
AL |
NL |
Total |
| Brooks Robinson | 4 | 4 | |
| Johnny Bench | 3 | 3 | |
| Ron Santo | 3 | 3 | |
| Orlando Cabrera | 3 | 3 | |
| Jackie Jensen | 3 | 3 |
Clearly quite different types of hitters from the sacrifice hits leaders. To further illustrate this point, here are the players since 1954 with seasons recording double-digit totals for both sacrifice hits and sacrifice flies.
| Rk | Player | Year | SH | SF | Age | Tm | G | PA | R | H | 2B | 3B | HR | RBI | BB | SO | Pos | |||
|---|---|---|---|---|---|---|---|---|---|---|---|---|---|---|---|---|---|---|---|---|
| 1 | Juan Uribe | 2005 | 11 | 10 | 25 | CHW | 146 | 540 | 58 | 121 | 23 | 3 | 16 | 71 | 34 | 77 | .252 | .301 | .412 | *6 |
| 2 | Ricky Gutierrez | 2001 | 17 | 11 | 31 | CHC | 147 | 606 | 76 | 153 | 23 | 3 | 10 | 66 | 40 | 56 | .290 | .345 | .402 | *6 |
| 3 | Roberto Alomar | 1999 | 12 | 13 | 31 | CLE | 159 | 694 | 138 | 182 | 40 | 3 | 24 | 120 | 99 | 96 | .323 | .422 | .533 | *4/D |
| 4 | Kevin Elster | 1996 | 16 | 11 | 31 | TEX | 157 | 596 | 79 | 130 | 32 | 2 | 24 | 99 | 52 | 138 | .252 | .317 | .462 | *6 |
| 5 | Omar Vizquel | 1995 | 10 | 10 | 28 | CLE | 136 | 622 | 87 | 144 | 28 | 0 | 6 | 56 | 59 | 59 | .266 | .333 | .351 | *6 |
| 6 | Jerry Browne | 1990 | 12 | 11 | 24 | CLE | 140 | 610 | 92 | 137 | 26 | 5 | 6 | 50 | 72 | 46 | .267 | .353 | .372 | *4 |
| 7 | Wally Joyner | 1986 | 10 | 12 | 24 | CAL | 154 | 674 | 82 | 172 | 27 | 3 | 22 | 100 | 57 | 58 | .290 | .348 | .457 | *3 |
| 8 | Rob Wilfong | 1979 | 25 | 10 | 25 | MIN | 140 | 485 | 71 | 131 | 22 | 6 | 9 | 59 | 29 | 54 | .313 | .352 | .458 | *4/879 |
| 9 | Bert Campaneris | 1976 | 18 | 11 | 34 | OAK | 149 | 631 | 67 | 137 | 14 | 1 | 1 | 52 | 63 | 80 | .256 | .331 | .291 | *6 |
| 10 | Brooks Robinson | 1962 | 10 | 10 | 25 | BAL | 162 | 697 | 77 | 192 | 29 | 9 | 23 | 86 | 42 | 70 | .303 | .342 | .486 | *5/64 |
| 11 | Johnny Temple | 1959 | 11 | 13 | 31 | CIN | 149 | 696 | 102 | 186 | 35 | 6 | 8 | 67 | 72 | 40 | .311 | .380 | .430 | *4 |
That’s it -11 player seasons in the last 60 years. Relaxing it to find players with double-digit seasons of both, but in different years, still yields a remarkably small group.
| Rk | Player | SF Yrs | From-To | SH Yrs | From-To |
|---|---|---|---|---|---|
| 1 | B.J. Surhoff | 4 | 1989-1998 | 2 | 1988-1991 |
| 2 | Brooks Robinson | 3 | 1962-1969 | 2 | 1960-1962 |
| 3 | Roberto Alomar | 2 | 1996-1999 | 6 | 1988-2003 |
| 4 | Omar Vizquel | 2 | 1995-2002 | 14 | 1989-2007 |
| 5 | Robin Yount | 2 | 1982-1992 | 4 | 1975-1979 |
| 6 | Gil Hodges | 2 | 1954-1955 | 2 | 1949-1950 |
Above are the only players with 2 or more seasons with 10+ sacrifice flies, and also 2 or more seasons with 10+ sacrifice bunts.
So, it shouldn’t be surprising that we’ve never had a player lead his league in both categories in the same season. I did say, though, that there have been players to lead their league in both categories in different seasons. Here they are:
| Rk | Player | Lg | SF Title | Lg | SH Title |
|---|---|---|---|---|---|
| 1 | Roberto Alomar | AL | 1999 | NL | 1989 |
| 2 | Vic Power | AL | 1961 | AL | 1963 |
| 3 | Frank Bolling | AL | 1958 | NL | 1963 |
| 4 | Johnny Temple | NL | 1959 | NL | 1957, 1958 |
So, only Roberto Alomar has done this since the early 1960s. And, he did so in widely separated seasons: leading in sac bunts when younger and quicker; and in sac flies when older and slower. Which makes Cozart’s season all the more interesting.
SPECIAL EXTRA
HHS reader brp mentioned that Cozart leading in both categories could be related to splitting his playing time between different spots in the batting order. Here, then are the record SH totals by batting order position and era.
And, the same for sacrifice flies. Note that Bert Campaneris, Roberto Alomar and Shawon Dunston show up in both the Sacrifice Hit and Sacrifice Fly tables.
| BOP | 1954-1969 | 1970-1989 | 1990-2012 |
|---|---|---|---|
| 1st | 12 Johnny Temple 1959 | 8 Lou Whitaker 1983
8 Don Kessinger 1975 |
12 Johnny Damon 2000 |
| 2nd | 8 Al Dark 1956 | 10 Jim Gantner 1984
10 Bert Campaneris 1976 |
15 Mark Loretta 2004 |
| 3rd | 11 Alex Johnson 1969 | 18 Andre Dawson 1983 | 13 Roberto Alomar 1999
13 Carlos Baerga 1993 13 Frank Thomas 1993 13 Joe Carter 1992 13 Kelly Gruber 1990 13 Will Clark 1990 |
| 4th | 14 Ron Santo 1969 | 14 Dave Kingman 1984 | 16 Juan Gonzalez 2001 |
| 5th | 10 Jackie Jensen 1959 | 10 Rico Petrocelli 1970 | 13 J.T. Snow 2000
13 Barry Bonds 1991 |
| 6th | 10 Jim Piersall 1956 | 8 Jim Presley 1985
8 Ray Knight 1983 8 Garry Maddox 1981 |
8 Edgar Renteria 2004
8 Richard Hidalgo 2001 |
| 7th | 6 Reno Bertoia 1958
6 Joe DeMaestri 1954 |
8 Rey Quinones 1989
8 Ray Knight 1986 |
8 Shawon Dunston 1991 |
| 8th | 9 Dick Hall 1954 | 9 Dale Berra 1984 | 7 Mike Lamb 2008
7 Dan Wilson 2002 |
| 9th | 4 Denny Lemaster 1964
4 Warren Spahn 1959 4 Bob Keegan 1954 |
9 Bucky Dent 1977 | 11 Kevin Elster 1996 |


