On our recent podcast (now available on iTunes–just search for High Heat Stats), Adam raised the question of variability in hit-by-pitch totals over the years, and none of us had an exact answer right away.
I’ve delved into it a bit, and was quite surprised by the results.
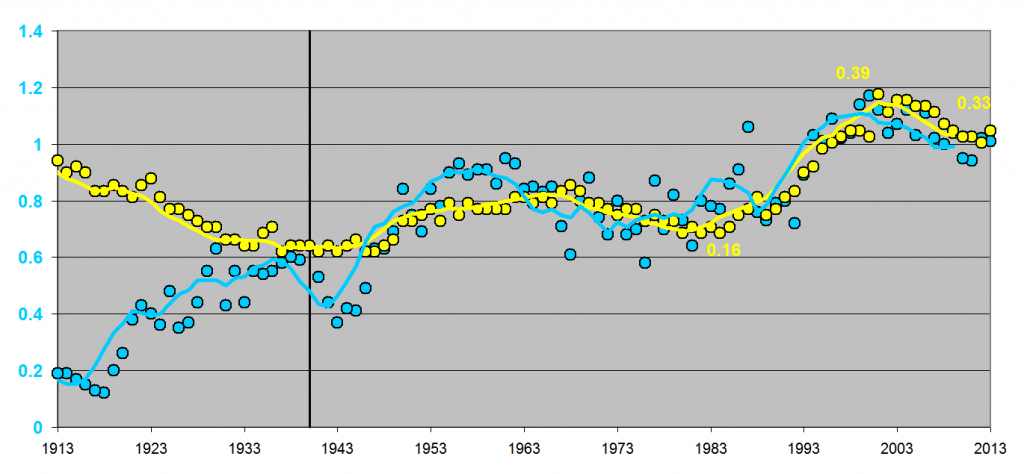
Below is a plot that shows both home runs and HBP on a per-game basis. It needs a bit of explanation, so see below for that.
(click on it for a larger version)
The blue data series is home runs, per team per game. The left axis, ranging from 0 to 1.4 is for home runs only. The yellow data series is HBP, per team per game, and is scaled differently. See the yellow numbers I’ve placed showing low (0.16 in the early 1980s), peak (0.39 in 2001) and current (0.33 in 2o13). I’ve added a black like at 1940. Before that line, there appears to be no correlation (or perhaps an inverse correlation) between HR and HBP. Starting early in the 1940s, though, there is a large correlation between HR and HBP.
I found the best linear scaling of the HBP to get it to correlate with the HR data. For those who care, I used a least-squares method. It turns out that was subtracting 0.160 from each year’s HBP value, then multiplying by 2.14, we get the above plot, the least squares fit.
The interesting thing, then, is that the baseline of 0.160 is the average amount of HBP that happens every year regardless of the HR value, so this is probably pretty close to the baseline HBP level in the majors. That means that this year, roughly half of HBP are intentional (home-run retaliation or previous HPB retaliation). In the early 2000s, more like 60% of all HBP were of the intentional variety. In the early 1980s, virtual none of the HBP in the league were intentional.
Also, unrelated but interestingly, note the time lag between HR and HBP. It’s most apparently in the last 20-30 years, where there is a 1-2 year delay between changes in HR rate and HBP rate.

