This just in – strikeouts are up again in 2013, averaging more than 7.5 per 9 innings. This is the 10th year-over-year increase in the past 14 seasons, and the 5th straight year setting a new all-time high. Not news to most readers here. Question, though, is this – is it good for the game? Does striking out a lot as the price for belting more homers really help a team score more runs? At what point, if any, does the cost outweigh the benefits?
What follows is a visual statistical analysis of strikeouts and home runs, the relationship between the two, and how that relationship contributes to or detracts from run scoring. No heavy lifting, but I hope you may come away with some new insights on this very pervasive influence on today’s game.
All of the data depicted below were obtained from FanGraphs and Baseball-Reference. The various (and oddball) metrics derived from them are my own, so I am to blame for any errors in their conception or execution.
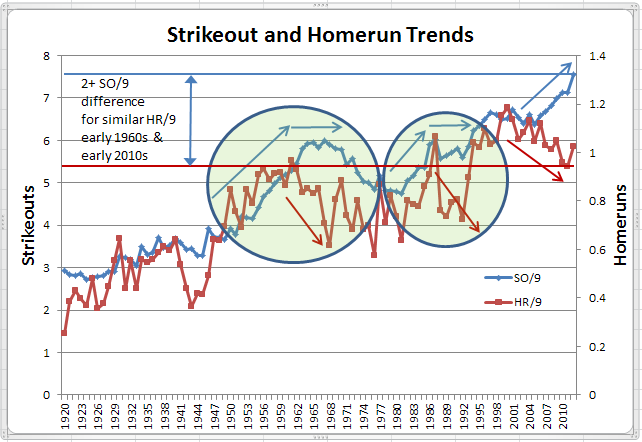
So let’s start with the frequency of strikeouts and home runs in the live ball era. Below is a chart showing a mostly consistent increase in both home runs and strikeouts from the start of the live ball era to today.
The overall trend is that strikeouts and home runs increase in tandem. However, that trend has broken down at times, typically after periods of rapid increases. Two such periods are shown in the circled areas. In each the steep rise in home runs and strikeouts was interrupted by a home run decline accompanied by strikeouts leveling off, as indicated by the arrows in the circled areas.
The most recent period, beginning early this century is different from at any time previously. Home runs are declining but strikeouts have not leveled off. Instead, they have continued to rise, trending in the opposite direction from home runs, a pattern not seen previously for more than a few years without correcting.
Note also that the decline in home runs has been substantial, with home run rates in 2010 and 2011 at the same level as was seen as far back as the early 1960s. The big difference between then and now – the “cost” for producing that home run output has soared, with strikeouts up by more than 2 SO/9 from the level of more than 50 years ago.
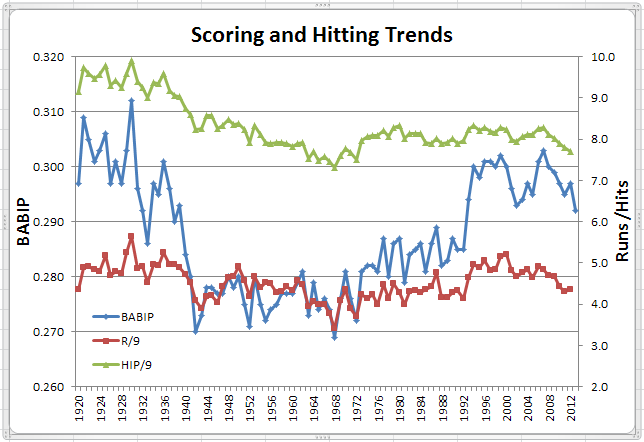
Next, let’s look at run production. The chart below shows R/9 (the brown line) always between 3 and 6 runs per 9 innings, and usually in a much tighter range than that. In fact, with just a few exceptions (notably the late 1960s and early 1970s), R/9 was between 4 and 5 for almost 60 years, from 1937 to 1995. Before and after those dates, runs were higher as was BABIP. Note though the relationship between BABIP and Hits in Play (i.e. H – HR). In the 1920s and 1930s a BABIP in the .290 to.310 range equated to close to or above 9 HIP/9, whereas a .290 to .300+ BABIP in the 1990s and 2000s yielded only around 8 HIP/9 (more on that later).
Interesting phenomenon with BABIP. Cratered during the war due to inferior baseballs and hitters, but the steep downward trend was already evident in the late 1930s. Then basically bounced around in the .270s for 35 years, before starting to trend gradually upwards. Then in the early 1990s it suddenly spiked way up, almost as sharply as BABIP had spiked down at the end of the 1930s.
But, look what has happened since 2005. Runs, Hits in Play and BABIP are all declining steadily. As with home runs, runs and hits are also now at about the same level as in the early 1960s, but BABIP, despite its decline, is still a good 10 or 15 points higher than 50+ years ago. So, why are runs seemingly tougher to produce now than in the past?
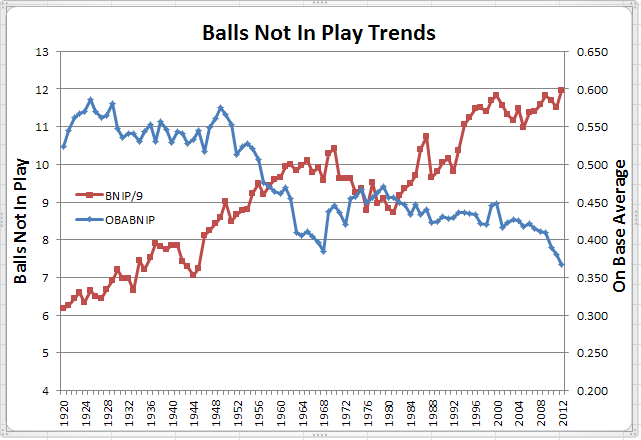
The chart below provides an answer. In essence, to produce the same quantity of runs, batters have to produce more with the balls they put in play to compensate for producing less with the balls not put into play. Ergo, the cost of the ever-increasing strikeout count.
Since 1920, balls not in play (HRs, SOs, BBs, HBPs) have doubled to about 12 per 9 innings today, almost one-third of the PAs (31.2% in 2012) in a game. That upward trend in BNIP has been pretty consistent throughout the live ball era with the exception of the decade of the 1970s.
As balls not in play have risen, the on-base percentage arising from them has steadily declined. Strikeouts first exceeded the sum of other BNIPs in the mid 1950s and, aside from the 1970s, have been rising at a faster rate than walks and home runs. To maintain run scoring, then, home runs must compensate for the negative effects of ever-increasing strikeouts. How well has that worked?
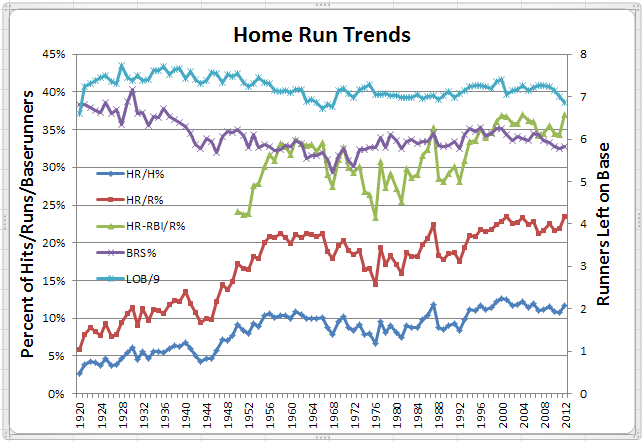
The chart below has a lot of information. The bottom three lines are all showing the increasing influence of home runs, measured as a % of Hits, a % of Runs, and as the % of runs resulting directly from home runs (i.e. RBI on HRs). The top two lines show the effects of that influence: the purple line indicates the % of baserunners (excluding baserunners out on base) scoring, being (R – HR) / (BF – HR – IP*3); and the teal or cyan line indicates baserunners left on base, being (BF – R – IP*3).
So, home runs have more than tripled since 1920, both as a proportion of hits and as a proportion of runs scored. That being said, by far the largest proportion of this increase occurred prior to 1960. Runs driven in by home runs (only available from P-I since 1950), as a proportion of all runs scored, are up over 60% since 1950 with the largest proportion of that increase again occurring prior to 1960. Notwithstanding the timing of the increases in those metrics, all three are currently at or very near all-time highs.
So, what has been the effect of this burgeoning increase in long balls? Less than you might suppose. The % of baserunners scoring has held in a tight range of 30%-35% since the late 1930s and is currently in a declining trend since peaking in the mid-1990s. Similar story for runners left on base. Even though home runs ought to be very efficient in clearing the bases, runners left on base has been hovering around 7 per game since the early 1970s. The downward trend since 2005 has more to do with having fewer baserunners overall (recall the recent decline in HIP/9 in the second chart) than with increased efficiency of run scoring via the home run.
So, what does it all mean? I alluded in the title of this post to a zero-sum game. What I meant is that most of the time there is a kind of balance between home runs and strikeouts that usually results in a fairly stable run scoring environment. However, when that balance is thrown out of whack, there can be some fairly sudden and dramatic jolts to run scoring. This phenomenon is illustrated in the chart below.
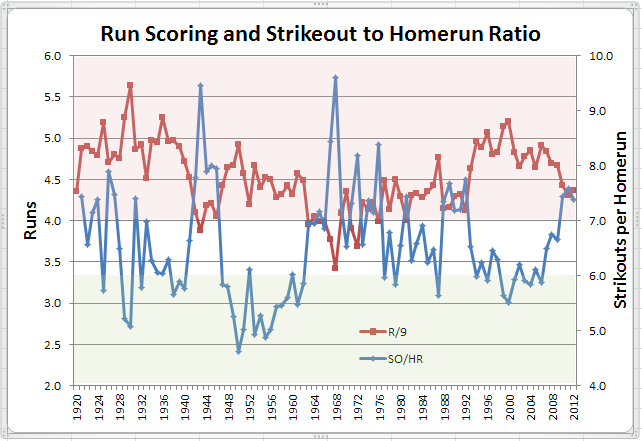
What I’m showing with the blue line is the ratio between strikeouts and home runs. While there is certainly some whipsawing in the year-to-year fluctuations in that ratio, most of the time, that ratio is running between 5.5 and 8.0 strikeouts per home run. The jolts to run scoring seem to occur when the SO/HR ratio moves into either the Red or Green areas shown on the chart.
For example, SO/HR moved from the green area (favorable to run scoring) in 2006 into the red area (unfavorable) by 2010. The effect? R/9 moved down by more than half a run from 2006 to 2012. Similarly, SO/HR moved from green in 1962 to bright red in 1967, reducing R/9 by over 0.7 and by over a full run when SO/HR shot up over 9 the following year. On the flip side, SO/HR went from red to green from 1946 to 1947, with an immediate increase in R/9 of over one-third of a run. By 1950, SO/HR was well into the green range and R/9 had improved by almost a full run from 1946 levels.
What does 2013 look like? Well, it’s only a month into the season, but SO/HR is pushing 8.0, well into red territory. At this juncture further declines in run scoring seem likely.
To close, here are players with a minimum 200 career HRs and a career SO/HR ratio below 2.0.
| Rk | Player | HR | WAR/pos | SO | From | To | Age | G | PA | R | H | RBI | BB | Tm | |
|---|---|---|---|---|---|---|---|---|---|---|---|---|---|---|---|
| 1 | Hank Aaron | 755 | 142.3 | 155 | 1383 | 1954 | 1976 | 20-42 | 3298 | 13941 | 2174 | 3771 | 2297 | 1402 | MLN-ATL-MIL |
| 2 | Babe Ruth | 714 | 163.3 | 206 | 1330 | 1914 | 1935 | 19-40 | 2503 | 10622 | 2174 | 2873 | 2220 | 2062 | BOS-NYY-BSN |
| 3 | Ted Williams | 521 | 123.2 | 190 | 709 | 1939 | 1960 | 20-41 | 2292 | 9788 | 1798 | 2654 | 1839 | 2021 | BOS |
| 4 | Mel Ott | 511 | 107.8 | 155 | 896 | 1926 | 1947 | 17-38 | 2730 | 11348 | 1859 | 2876 | 1860 | 1708 | NYG |
| 5 | Lou Gehrig | 493 | 112.6 | 179 | 790 | 1923 | 1939 | 20-36 | 2164 | 9663 | 1888 | 2721 | 1992 | 1508 | NYY |
| 6 | Albert Pujols | 479 | 91.7 | 167 | 793 | 2001 | 2013 | 21-33 | 1886 | 8229 | 1388 | 2272 | 1452 | 1042 | STL-LAA |
| 7 | Stan Musial | 475 | 128.2 | 159 | 696 | 1941 | 1963 | 20-42 | 3026 | 12717 | 1949 | 3630 | 1951 | 1599 | STL |
| 8 | Joe DiMaggio | 361 | 78.3 | 155 | 369 | 1936 | 1951 | 21-36 | 1736 | 7673 | 1390 | 2214 | 1537 | 790 | NYY |
| 9 | Johnny Mize | 359 | 70.9 | 158 | 524 | 1936 | 1953 | 23-40 | 1883 | 7370 | 1118 | 2011 | 1337 | 856 | STL-NYG-TOT-NYY |
| 10 | Yogi Berra | 358 | 59.3 | 125 | 414 | 1946 | 1965 | 21-40 | 2120 | 8359 | 1175 | 2150 | 1430 | 704 | NYY-NYM |
| 11 | Chuck Klein | 300 | 43.5 | 137 | 521 | 1928 | 1944 | 23-39 | 1753 | 7170 | 1168 | 2076 | 1201 | 601 | PHI-CHC-TOT |
| 12 | Ted Kluszewski | 279 | 32.1 | 123 | 365 | 1947 | 1961 | 22-36 | 1718 | 6469 | 848 | 1766 | 1028 | 492 | CIN-PIT-TOT-CHW-LAA |
| 13 | Hal Trosky | 228 | 30.4 | 130 | 440 | 1933 | 1946 | 20-33 | 1347 | 5749 | 835 | 1561 | 1012 | 545 | CLE-CHW |
| 14 | Sid Gordon | 202 | 38.3 | 129 | 356 | 1941 | 1955 | 23-37 | 1475 | 5813 | 735 | 1415 | 805 | 731 | NYG-BSN-MLN-PIT-TOT |
| 15 | Bill Dickey | 202 | 55.9 | 127 | 289 | 1928 | 1946 | 21-39 | 1789 | 7064 | 930 | 1969 | 1209 | 678 | NYY |
At the other end of the spectrum, these are the 200 HR hitters with a SO/HR ratio above 6.0.
| Rk | Player | HR | WAR/pos | SO | From | To | Age | G | PA | R | H | RBI | BB | Tm | |
|---|---|---|---|---|---|---|---|---|---|---|---|---|---|---|---|
| 1 | Craig Biggio | 291 | 64.8 | 112 | 1753 | 1988 | 2007 | 22-41 | 2850 | 12504 | 1844 | 3060 | 1175 | 1160 | HOU |
| 2 | Bobby Abreu | 287 | 60.5 | 129 | 1819 | 1996 | 2012 | 22-38 | 2347 | 9926 | 1441 | 2437 | 1349 | 1456 | HOU-PHI-TOT-NYY-LAA |
| 3 | Mike Cameron | 278 | 46.7 | 106 | 1901 | 1995 | 2011 | 22-38 | 1955 | 7884 | 1064 | 1700 | 968 | 867 | CHW-CIN-SEA-NYM-SDP-MIL-BOS-TOT |
| 4 | Derek Jeter | 255 | 72.2 | 117 | 1743 | 1995 | 2012 | 21-38 | 2585 | 11895 | 1868 | 3304 | 1254 | 1039 | NYY |
| 5 | Rick Monday | 241 | 33.1 | 125 | 1513 | 1966 | 1984 | 20-38 | 1986 | 7162 | 950 | 1619 | 775 | 924 | KCA-OAK-CHC-LAD |
| 6 | Ray Lankford | 238 | 37.8 | 123 | 1550 | 1990 | 2004 | 23-37 | 1701 | 6675 | 968 | 1561 | 874 | 828 | TOT-SDP-STL |
| 7 | Rob Deer | 230 | 13.7 | 109 | 1409 | 1984 | 1996 | 23-35 | 1155 | 4513 | 578 | 853 | 600 | 575 | SFG-MIL-DET-TOT-SDP |
| 8 | Travis Fryman | 223 | 34.2 | 104 | 1369 | 1990 | 2002 | 21-33 | 1698 | 7217 | 895 | 1776 | 1022 | 602 | DET-CLE |
| 9 | Devon White | 208 | 47.0 | 98 | 1526 | 1985 | 2001 | 22-38 | 1941 | 8080 | 1125 | 1934 | 846 | 541 | CAL-TOR-FLA-ARI-LAD-MIL |
| 10 | Pete Incaviglia | 206 | 10.2 | 104 | 1277 | 1986 | 1998 | 22-34 | 1284 | 4677 | 546 | 1043 | 655 | 360 | TEX-DET-HOU-PHI-TOT |
Among active players, here are the players with the best SO/HR ratio, all below 3.25 (Pujols, at 1.66, is the only player below 3.0).
| Rk | Player | HR | WAR/pos | SO | From | To | Age | G | PA | R | H | RBI | BB | Tm | |
|---|---|---|---|---|---|---|---|---|---|---|---|---|---|---|---|
| 1 | Alex Rodriguez | 647 | 115.7 | 143 | 2032 | 1994 | 2012 | 18-36 | 2524 | 11163 | 1898 | 2901 | 1950 | 1217 | SEA-TEX-NYY |
| 2 | Albert Pujols | 480 | 91.8 | 167 | 793 | 2001 | 2013 | 21-33 | 1887 | 8233 | 1389 | 2273 | 1453 | 1042 | STL-LAA |
| 3 | Paul Konerko | 426 | 29.6 | 121 | 1287 | 1997 | 2013 | 21-37 | 2168 | 8869 | 1116 | 2205 | 1351 | 873 | LAD-TOT-CHW |
| 4 | Todd Helton | 355 | 61.6 | 135 | 1094 | 1997 | 2013 | 23-39 | 2136 | 9056 | 1364 | 2431 | 1355 | 1299 | COL |
| 5 | Aramis Ramirez | 342 | 30.2 | 116 | 1044 | 1998 | 2013 | 20-35 | 1836 | 7603 | 966 | 1964 | 1229 | 547 | PIT-TOT-CHC-MIL |
| 6 | Carlos Quentin | 139 | 8.9 | 119 | 441 | 2006 | 2013 | 23-30 | 720 | 2836 | 372 | 614 | 438 | 256 | ARI-CHW-SDP |
And, the worst of today’s hackers, all above 6.0, in descending HR order.
| Rk | Player | HR | WAR/pos | SO | From | To | Age | G | PA | R | H | RBI | BB | Tm | |
|---|---|---|---|---|---|---|---|---|---|---|---|---|---|---|---|
| 1 | Derek Jeter | 255 | 72.2 | 117 | 1743 | 1995 | 2012 | 21-38 | 2585 | 11895 | 1868 | 3304 | 1254 | 1039 | NYY |
| 2 | Mark Reynolds | 189 | 7.4 | 111 | 1145 | 2007 | 2013 | 23-29 | 877 | 3543 | 493 | 725 | 523 | 418 | ARI-BAL-CLE |
| 3 | Michael Young | 178 | 25.7 | 104 | 1171 | 2000 | 2013 | 23-36 | 1852 | 8157 | 1096 | 2263 | 990 | 543 | TEX-PHI |
| 4 | Alex Gonzalez | 157 | 10.4 | 80 | 1152 | 1998 | 2013 | 21-36 | 1579 | 6174 | 658 | 1405 | 686 | 298 | FLA-BOS-CIN-TOT-ATL-MIL |
| 5 | Brandon Inge | 151 | 19.7 | 83 | 1281 | 2001 | 2013 | 24-36 | 1491 | 5536 | 561 | 1156 | 644 | 442 | DET-TOT-PIT |
| 6 | Jayson Werth | 149 | 22.4 | 117 | 965 | 2002 | 2013 | 23-34 | 1033 | 4039 | 561 | 930 | 505 | 483 | TOR-LAD-PHI-WSN |
| 7 | Jhonny Peralta | 147 | 21.9 | 100 | 1086 | 2003 | 2013 | 21-31 | 1302 | 5347 | 635 | 1276 | 656 | 446 | CLE-TOT-DET |
| 8 | Miguel Olivo | 143 | 8.0 | 82 | 1036 | 2002 | 2013 | 23-34 | 1098 | 3928 | 429 | 891 | 483 | 154 | CHW-TOT-FLA-KCR-COL-SEA-MIA |
| 9 | Jeff Francoeur | 138 | 8.7 | 94 | 869 | 2005 | 2013 | 21-29 | 1170 | 4799 | 548 | 1183 | 610 | 242 | ATL-TOT-KCR |
| 10 | Jonny Gomes | 137 | 4.1 | 109 | 844 | 2003 | 2013 | 22-32 | 902 | 3121 | 395 | 656 | 413 | 321 | TBD-TBR-CIN-TOT-OAK-BOS |
| 11 | Eric Hinske | 137 | 8.4 | 99 | 937 | 2002 | 2013 | 24-35 | 1356 | 4275 | 548 | 943 | 520 | 447 | TOR-BOS-TBR-TOT-ATL-ARI |
| 12 | Lyle Overbay | 137 | 17.2 | 108 | 952 | 2001 | 2013 | 24-36 | 1349 | 5110 | 586 | 1209 | 593 | 571 | ARI-MIL-TOR-TOT-NYY |
Of the above group, Gonzalez, Inge, Peralta and Olivo all have a SO/HR ratio above 7.0, with Inge leading the way at a whopping 8.5.
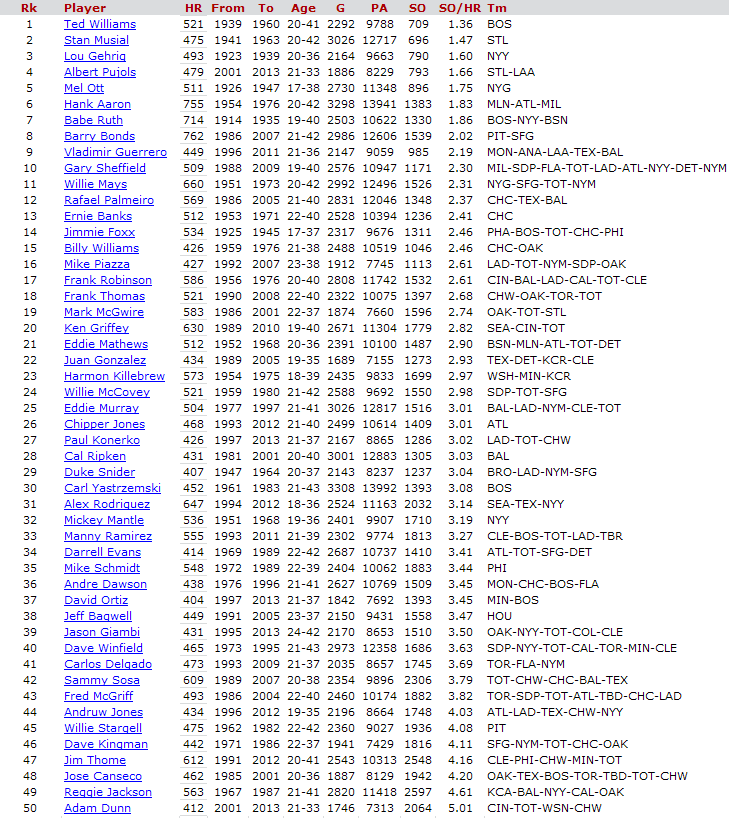
Finally, the top 50 all-time home run hitters (aka the 400 home run club) all have a SO/HR ratio below 5.0, with a lone exception, whom I’m sure most of you will be able to guess. So, here is our 400 HR club in order of SO/HR ratio.

