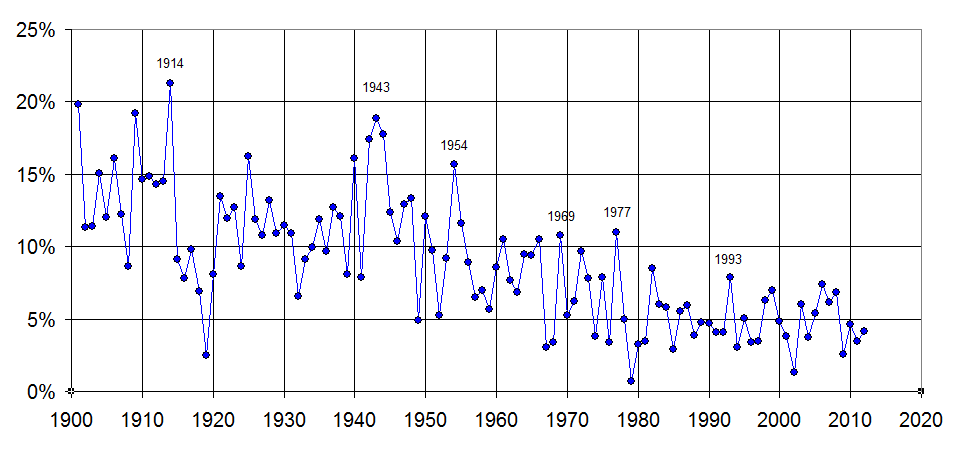
Percentage of full seasons played by rookies

Here’s a simple calculation that reveals lots of interesting stuff. Using B-R.com’s new option to limit searches to players who qualify as rookies (using the modern definition only), it’s easy to find what fraction of players each season who qualified for the batting title also qualified as rookies.

This is what the data looks like:

percentage rookies

The overall trend is clear. In the early part of the 20th century, about 15% of full-time players were rookies. There is an uptick in 1914 as the Federal League was formed and lots of new players were brought in. In the late 1910s, nearly no rookies played full seasons but by the 1920s the rate was back up to about 12%. When World War II came around, the rate spiked as a lot of established players left for military service. There was a spike from 1952 into 1953, due to the Korean War. The rate spiked even further in 1954, but I’m not sure why, as that war was already over and guys like Ted Williams and Willy Mays were back.

By the 1960s, the rate of rookies dropped down to about 9%. In the 1970s, it went even lower, plummeting to an all-time low in 1979. From 1980 on, the rate has been relatively consistent around 5%. Note a few upticks in expansion years of 1969, 1977, and 1993.

I wonder why the fraction of rookies has dropped gradually over time? September call-ups probably have something to do with it–more players qualifying as rookies before playing a full qualifying season. There may just also be less playing of rookies full time–for example fewer rookies winning jobs in spring training.

What else can we surmise from this data?

0 0 votes
Article Rating
Subscribe
Notify of
guest

16 Comments
Oldest
Newest Most Voted
Inline Feedbacks
View all comments
Mike L
Mike L
11 years ago

Service time and its effect on arbitration might play a role. Also multiyear contracts for veterans which locks the team in place and the rookie in triple a. And perhaps free agency itself. In the past if you needed a player you either had to trade for him, perhaps creating another hole, or bring up whomever you had in the minors. Now you can just buy him in the offseason. The 54 spike and the echo over the following two years is interesting. I wonder if it somehow correlates in age to retirements of those who came back from WWII.

Richard Chester
Richard Chester
11 years ago
Reply to  Mike L

In 1954 10 of the 13 qualifying rookies were on just 4 teams: 3 each on the A’s and Pirates and 2 each on the Cubs and Tigers.

brp
brp
11 years ago

I’m not sure how big the effect of either one is, but here’s two thoughts: 1) DH rule in 1973 has allowed some players to stay around in the AL longer than they might have otherwise. I realize we’re talking at most only a dozen guys or fewer, but those are roster spots that can’t go to a rookie then. 2) Better training and nutrition allows for longer careers for some players, I’m sure; and that dip around 2002 meshes pretty well with the steroid era. I think both of those combined is probably just a 1-2% at most, though,… Read more »

Doug
Editor
11 years ago

Just a guess, but I suspect that a plot of the average age of those rookies overlaid on the chart would show an opposite trend towards older rookies. That could explain why the % of rookies has declined – they’re kept in the minors longer to make sure they are ready when they’re called up. Another factor is free agency. Before UFAs, if you had a hole to fill in your lineup and you couldn’t swing a desirable trade, you pretty much had to bring up someone from the farm (could be a kid, or a re-tread vet). Now, you… Read more »

Bryan O'Connor
Editor
11 years ago

It looks like 1979 is below 1%. Does that mean two rookies qualified for the batting title that year? 26 teams * 8 hitters = 208 qualifiers, which is probably on the high end given platooning/injuries.

cubbies
cubbies
11 years ago
Reply to  Bryan O'Connor

from my search, looks like it was just alfredo griffin that year.

he tied john castino (445 PA) for AL ROY that year.

my boy rick sutcliffe won the NL ROY.

cubbies
cubbies
11 years ago
Reply to  cubbies

and 139 players qualified for the batting title that year.

mosc
mosc
11 years ago

I might lower the limit rather than batting crown eligibility to something more reasonable to accumulate significant single season value. I feel like the rate for rookies contributing in their official “rookie” capacity has more sharply declined over time. It might be interesting to look at total WAR by “modern rookies” over the years too, which should also dip. Although that one might have an odd 2012 spike in it… I sense this coming out of the discussion on rookies sort of wasting their rookieness on fractional seasons but not sure of a better way to look at it. Another… Read more »

Hartvig
Hartvig
11 years ago

I don’t have time this morning to check this out but a few thoughts: 1) you mentioned the correlation of some of the spikes & the Federal League & WW2 & Korea. They also seemed to have happened during expansion seasons (or did you mention that and I missed it?) 2) Bill James wrote something about the number of minor league games played and how it relates over time- the effect of outside events like war and of things like expansion is obvious but I recall him saying that he couldn’t find any evidence that under normal circumstances players were… Read more »

John Autin
Editor
11 years ago

Hartvig’s point #3 is of a piece with a long essay in the BJHBA about evaluating the competitive level of a league. He called it “Peripheral Quality Indicators” and it’s in the Bob Lemon player rating. Bill’s #2 PQI was the average distance of the players from age 27. And I think the decline in the rate of rookies who play regularly reflects the general rise in the level of play. I do think that in the last 10 years or so, teams controlling service time for arbitration reasons plays a big role, as Mike noted. But the biggest factor,… Read more »

John Autin
Editor
11 years ago
Reply to  John Autin

For 1901-20, the number of qualifying rookies for some teams:

Worst teams (during the period):
33 – Cardinals
24 – Browns
24 – Braves
23 – Dodgers
21 – Yankees
19 – Senators

Best teams:
6 – Cubs
9 – Giants
12 – White Sox
12 – Tigers
14 – Red Sox
23 – Pirates

Only Pittsburgh doesn’t really fit the pattern that the weaker teams use more rookies.

Hartvig
Hartvig
11 years ago
Reply to  John Autin

“Hartvig’s point #3 is of a piece with a long essay in the BJHBA about evaluating the competitive level of a league”

And you’re right as always, of course.

But I’m certain there’s a connection somewhere to Gould with the article. I’ll have to see if I can find my book by him that’s got the baseball stuff in it and see if that’s where it is. He may have applied James’ line of reasoning to the maturation of a species rather than the other way around.

Brendan Bingham
Brendan Bingham
11 years ago
Reply to  Hartvig

Hartvig: I can confirm your SJ Gould memory, although I cannot quite nail down the source. I once read an essay of his in which IIRC he was talking about biological outliers. Rapidly evolving species (or perhaps populations living in a rapidly changing ecosystem) produce a wider range of biological forms than well-established species in stable environments. He drew the analogy to baseball, as he sometimes did in such essays, that pitchers winning 30 games in a season and batters hitting .400 used to be much more frequent. Such accomplishments were always in the tail of the distribution, even in… Read more »

Lawrence Azrin
Lawrence Azrin
11 years ago

Yes, I also recall Bill James referencing SJ Gould’s theories on biological outliers and the maturation of a species, I think it was in BJ’s book on the HOF. James’ point was that the average level of talent in MLB in the late nineteenth/early twentieth century was much lower, so that the very greatest players could exceed that lower league average by a lot more than recent/current MLB players could. So, for example, Rogers Hornsby’s .424 BA in 1924 is not THAT much better than George Brett’s .390 in 1980 or Nomah’s .372 in 2000. Another great point he made… Read more »

Ed
Ed
11 years ago

Since we’re looking at percentages and not raw data, it’s impossible to know if this trend is due to 1) fewer rookies meeting the threshold, 2) more veterans meeting the threshold, or 3) a combination of both. I’ll offer a few possibilities why there may be more veterans meeting the threshold: 1) Fewer roster spots for position players. This of course leads to less platooning, fewer days off in general, etc. 2) Quicker recovery time from injuries. An injury that might have sidelined someone for 6-8 weeks just a few years ago, now leads to someone only missing 2-3 weeks.… Read more »