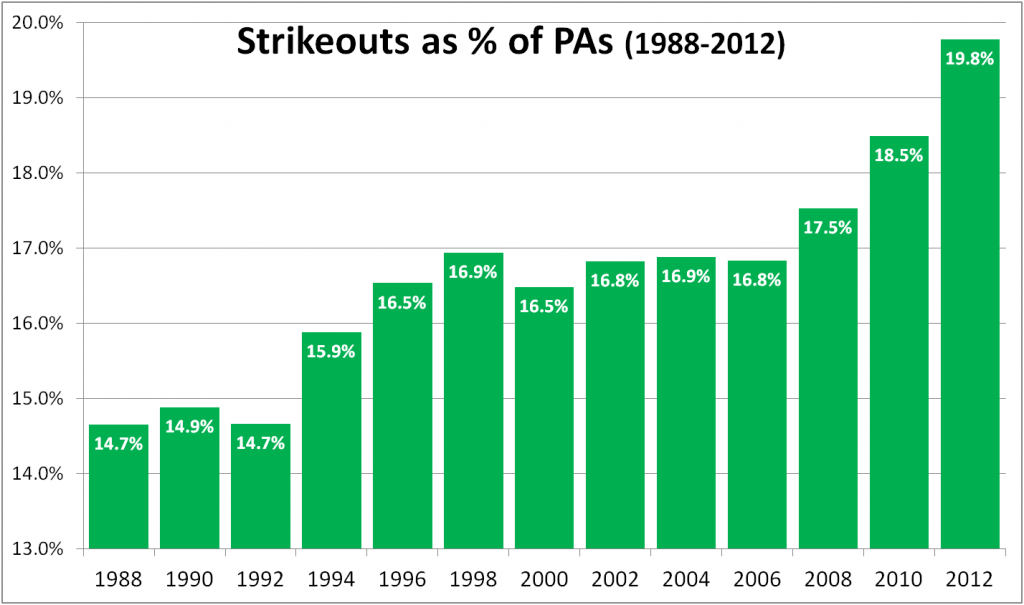
The MLB strikeout rate has risen 35% since 1988, climbing from 14.7% of all PAs to 19.8% in 2012. It’s not all the batters’ doing, and I’m not here to berate them, anyway. I just want to look at two basic parts on their side of the K-rate equation. Let’s show the basic rate before we break it down:
When we talk about the hitters’ role in K rates, we most often speak of their 2-strike approach. Modern hitters are less likely to cut down their swing with 2 strikes, or to swing at a pitch they can’t drive. So once they have 2 strikes, they’re more likely to strike out.
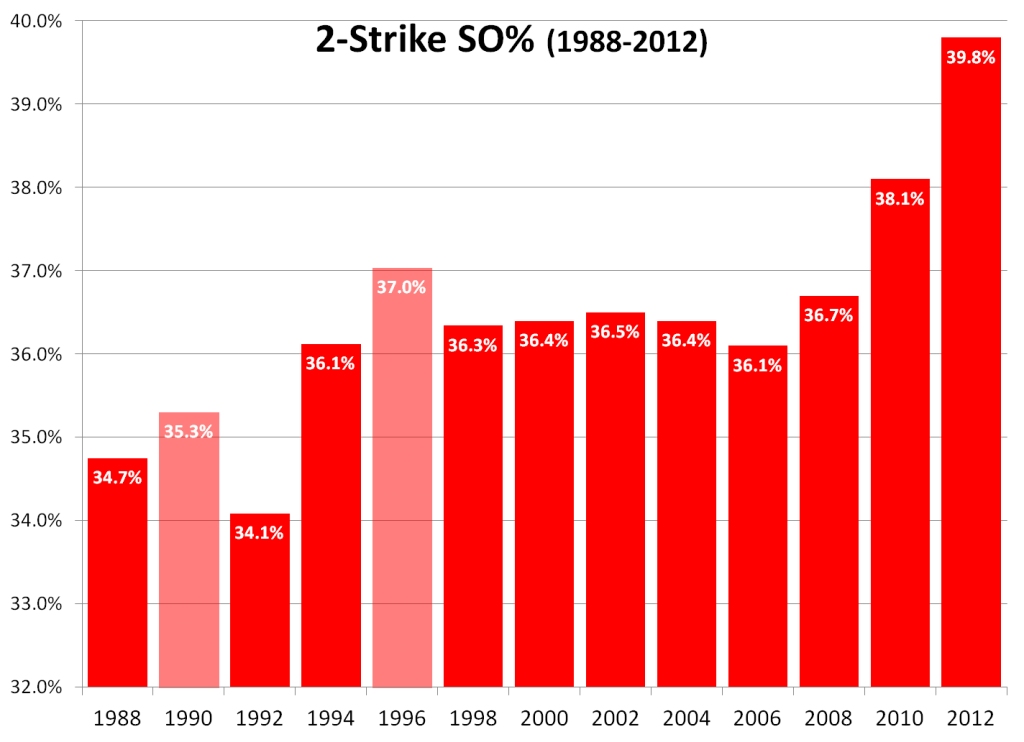
The following chart shows strikeouts as a percentage of all 2-strike counts (2-strike SO%), in 2-year increments from 1988-2012. (The lighter-colored bars for 1990 and 1996 indicate a significant number of missing data; about 8%-10% of the PAs in those years are missing the ball/strike count, so those calculated percentages are less reliable.)
But the rise in 2-strike SO% is only 15% since 1988. Where’s the rest of that 35% increase in overall K rate coming from?
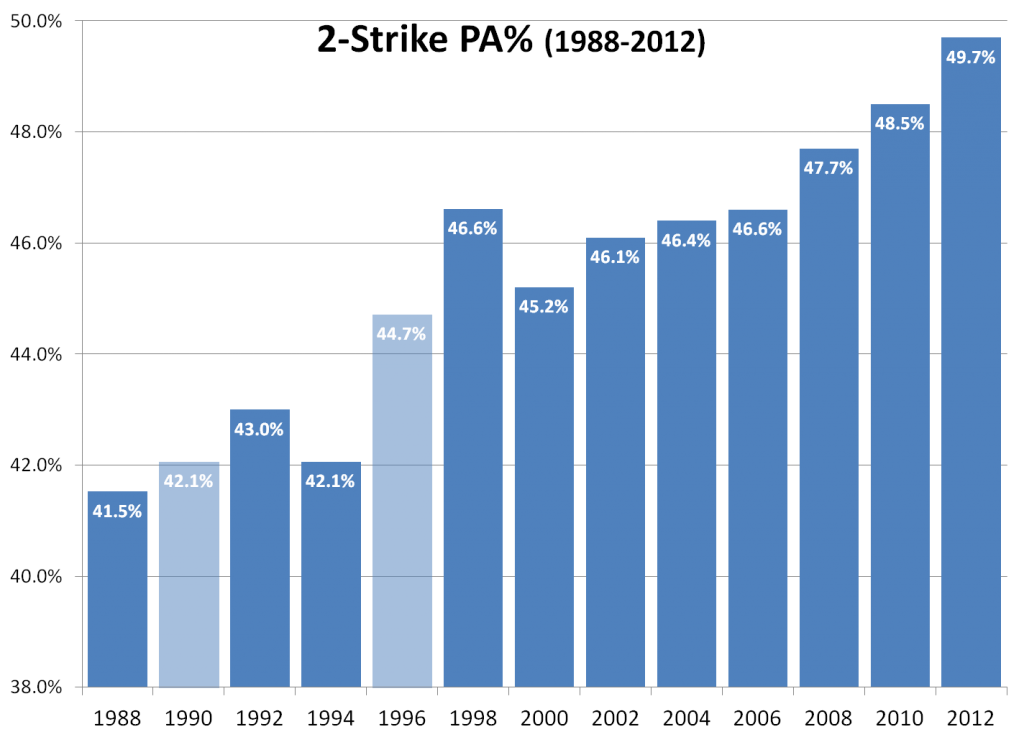
Well, you can’t strike out until you get to 2 strikes. The frequency of 2-strike counts is the other major piece of the equation. Here are 2-strike counts as a percentage of all PAs (2-strike PA%):
To my surprise, the 2-strike PA% has gone up more than the 2-strike SO%. From 1988-2012:
- The 2-strike SO% rose 15% (from 34.7% to 39.8%).
- The 2-strike PA% rose 20% (from 41.5% to 49.7%).
And the pace of change in these factors has been different. The 2-strike PA% has risen pretty steadily since 1988. But most of the rise in 2-strike SO% has come in the last 4 years. From 1988-2008, the net change in 2-strike SO% was less than 6%, with almost no net change from 1994 to 2008. But it’s risen more than 8% in the last 4 years.
If you have any thoughts on these data, you know what to do.


