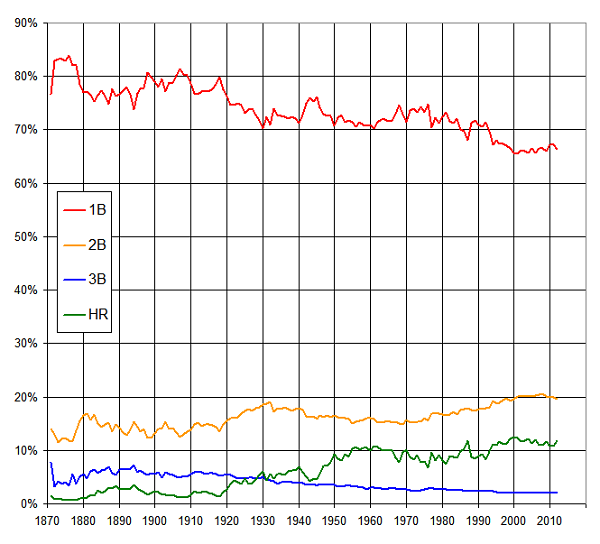
Here’s a pretty simple graph showing the breakdown each year of hits distribution.
So, for any given year, this shows the percentage of total hits for that year that were singles, doubles, triples, or homers.
Some observations / conclusions:
- Singles have, understandably, fallen off considerably. At the dawn of the game, they represented more than 80% of all hits but in recent years have been right around two-thirds. 2012’s percentage of 66.4 is among the lowest ever–just slightly above figures between 65 and 66 in the 2000’s.
- Triples increased in the 1880s and 1890s but have declined pretty steadily since except for renaissances in the 1910s and 1970s. The rate has hovered right around 2% for several years now.
- Doubles are quite interesting. You might have expected that they peaked in the late 1990s or early 200s (like homers) but their two peak seasons are actually 2007 and 2008, at 20.4% and 20.5% respectively. Doubles are off a bit in the last couple of years, probably largely because home runs have spiked again.
- Homers took a huge upward turn when Babe Ruth came on the scene, then took subsequent big jumps in the 1940s and the 1990s. They peaked in 2000 at 12.6%, fell as low as 10.8% in 2011 but rebounded last year to 11.8%.
- 1987 shows up again as a really fluke year. Home runs spiked up that year (then back down in 1988) and singles spiked way down (and then back up in 1988).
I wonder what singles will look like 50 years from now. The decline has been remarkably linear so far, losing just about 8/10ths of a percentage point each decade. I’m sure that rate will slow, or else singles will account for fewer than half of all hits by about the year 2206. (Although this is an accurate projection from the data, rest assured that my tongue is planted firmly in my cheek right now.)

