Since 1890, these are the largest annual changes in strikeout percentage:
- 1893, -38%
- 1901, +32%
- 1903, +21%
- 1946, +20%
- 1918, -17%
And these are the largest annual declines in strikeout percentage since 1890:
- 1893, -38%
- 1918, -17%
- 1899, -10%
- 1917, -9%
The three largest changes in SO% correspond with major rule changes. In 1893, the pitching distance was increased to 60′ 6″, and strikeouts plummeted. In 1901, the foul-strike rule was adopted by the National League, and the American League followed suit in 1903, with each move bringing a large rise in strikeouts.
The 1946 spike likely has much to do with the postwar return of the regular players — notably Bob Feller, whose 348 Ks in 1946 were one shy of the modern record and accounted for 22% of the raw SO increase over 1945 — and of regular ball-making materials. It still represents an 8% rise compared to 1940, which in turn was the highest rate since 1916. Hal Newhouser, perhaps the most notable holdover from wartime, averaged 5.4 SO/9 in 1944 and 6.1 in ’45, then surged to 8.5 SO/9 in 1946.
But what caused the large drop in SO% in 1917-18?
__________
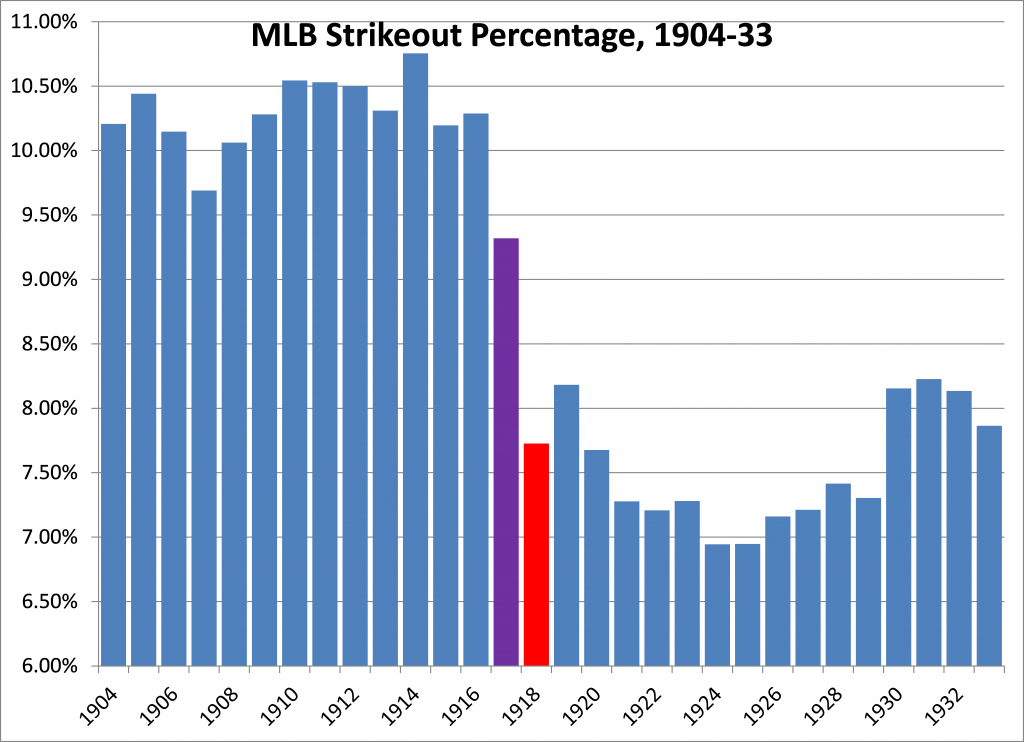
By 1903 both leagues had adopted the foul-strike rule, and from then through 1916, the MLB strikeout percentage ranged from 9.5% to 10.8%, with no annual change greater than 7%. But in 1917 the rate dipped by 9% — the 4th-biggest drop in modern times — to reach its lowest mark since 1902. A further plunge of 17% in 1918 — the biggest drop outside of the sea change brought by the modern pitching distance — lowered the rate to 7.7%, the lowest since either league counted fouls as strikes. That was 25% below the 1916 rate, and 23% below the 1903-16 average.
Here’s a chart, for you visual types. I’m told that 1917 is purple and 1918 is red:
The effect was seen broadly:
- The AL rate fell by 22% from 1916-18, the NL rate by 27%.
- Out of 97 batters with 200+ PAs in both 1916 and 1918, 70% saw their SO rate fall at least 20% over the two years, while just 3% had a rise of 20% or more. A dip of at least 10% was 11 times as common as a similar increase (80% vs. 7%).
- Out of 61 pitchers with 50+ IP in both 1916 and 1918, 72% saw their SO rate fall at least 20% over the two years, while just 5% had a rise of 20% or more. A dip of at least 10% was 10 times as common as a similar increase (84% vs. 8%).
- In 1916, the top 10 marks in SO/9 ranged from 5.9 to 4.7; the 1918 range was 5.2 to 3.6. And note the progression of the 1916 SO/9 leaders; every one declined in 1917 and again in 1918:
| Rk | 1916 | 1917 | 1918 | |
|---|---|---|---|---|
| 1 | Larry Cheney | 5.9 | 4.4 | 3.7 |
| 2 | Walter Johnson | 5.6 | 5.2 | 4.5 |
| 3 | Allen Russell | 5.5 | 4.7 | 3.4 |
| 4 | Lefty Williams* | 5.5 | 3.3 | 2.6 |
| 5 | Harry Harper* | 5.4 | 5.0 | 2.9 |
| 6 | Tom Hughes | 5.4 | 4.9 | n/a |
| 7 | Elmer Myers | 5.2 | 3.9 | 1.6 |
| 8 | Bullet Joe Bush | 4.9 | 4.7 | 4.1 |
| 9 | Claude Hendrix | 4.8 | 3.4 | 3.3 |
| 10 | Fred Anderson | 4.7 | 3.8 | 3.1 |
| 11 | Dutch Leonard* | 4.7 | 4.4 | 3.4 |
| 12 | Al Mamaux | 4.7 | 2.3 | n/a |
| 13 | Rube Marquard* | 4.7 | 4.5 | 3.4 |
| 14 | Babe Ruth* | 4.7 | 3.5 | 2.2 |
Table provided by Baseball-Reference.com.
But what was the cause? I’ve been searching all day, but I haven’t found it yet.
The size and breadth of the SO drop suggests some change in basic conditions. If the ban on doctored baseballs and the practice of keeping a fresher ball in play could be dated to 1917-18, that alone might explain the decline in strikeouts. But every source I can find dates those changes to the period of 1919-21, and especially to the death of Ray Chapman in August 1920.
The 1918 season was shortened by a month due to World War I, but I can’t see how the lack of September baseball by itself would affect strikeout rates. And while some players did lose time to WWI service or to defense-related jobs, the numbers were nothing like what was to come in the next war.
During 1917-18, there was no change in the official strike zone definition, nor any other significant rule changes to the game on the field.
I can’t rule out changes in visibility at existing stadiums, but no team changed parks from 1916 to ’18.
It’s interesting that the drop in strikeouts was not matched by a significant rise in batting average. The 1916 BA was .2476, rising to .2538 in 1918, a gain of just 2.5%. By comparison, the 1893 drop of 38% in SO% was accompanied by a 14% rise in BA, and the 1899 drop of 10% in SO% came with a 4% rise in BA. It’s also curious that home-run percentage fell by 25% from 1916 to 1918, but slugging average was virtually unchanged.
Whatever the causes, the 1918 strikeout rate became the “new normal.” The MLB SO% stayed between 6.9% and 8.2% from 1918 through 1933.
If you have any ideas on the cause of the 1917-18 drop in strikeouts, let us hear them!

