The highest WPA-rated hitting performance by a pitcher in 2012 was this game by Anthony Bass, the only pitcher with a game WPA score above 0.3.
| Rk | Player | Age | Date | Tm | Opp | Rslt | PA | AB | R | H | 2B | 3B | HR | RBI | BB | SO | WPA | RE24 | |
|---|---|---|---|---|---|---|---|---|---|---|---|---|---|---|---|---|---|---|---|
| 1 | Anthony Bass | 24.185 | 2012-05-04 | SDP | MIA | L 8-9 | 3 | 3 | 1 | 2 | 0 | 1 | 0 | 3 | 0 | 0 | 0.345 | 2.634 | 1.463 |
After allowing 5 runs on 4 hits (incl. 2 HR) in the opening frame, Bass redeemed himself with a two-out bases-loaded triple in the 3rd inning to put the Padres ahead 6-5 and chase opposing starter Josh Johnson. Bass left after 6 innings with a lead that the bullpen promptly surrendered en route to San Diego’s loss in 12 innings.
The last pitcher with a WPA score above 0.4 was in this game.
| Rk | Player | Age | Date | Tm | Opp | Rslt | PA | AB | R | H | 2B | 3B | HR | RBI | BB | SO | WPA | RE24 | |
|---|---|---|---|---|---|---|---|---|---|---|---|---|---|---|---|---|---|---|---|
| 1 | Mike Stanton | 26.342 | 1994-05-10 | ATL | PHI | W 9-8 | 2 | 2 | 0 | 2 | 0 | 0 | 0 | 1 | 0 | 0 | 0.433 | 1.326 | 3.635 |
Stanton was the Braves’ seventh pitcher of the game, entering in the 12th inning and pitching four scoreless frames. He singled leading off the 14th but was stranded. In the 15th, Stanton came up with two out and runners at 1st and 2nd. After Deion Sanders stole 3rd, Stanton delivered a walk-off bunt single on the next pitch.
Neither of these games, though, makes the top 10 of pitchers’ WPA games for the available data, which are mostly complete since 1950 with some games as early as 1948. After the jump, I’ll take a closer look at those top 10 games, and also at changes in how pitchers have batted in past 60 years or so.
David Letterman style, here are the 10 best WPA hitting performances by pitchers since 1950.
| Rk | Player | Age | Date | Tm | Opp | Rslt | PA | AB | R | H | 2B | 3B | HR | RBI | BB | SO | WPA | RE24 | |
|---|---|---|---|---|---|---|---|---|---|---|---|---|---|---|---|---|---|---|---|
| 10 | Satchel Paige | 45.332 | 1952-06-03 | SLB | WSH | W 3-2 | 3 | 3 | 0 | 3 | 0 | 0 | 0 | 1 | 0 | 0 | 0.476 | 1.396 | 2.337 |
10 – A month before his 46th birthday, Satchel Paige entered this game in the 12th inning and immediately induced a double-play grounder to end a Senators’ threat. Paige singled with the bases empty in the 13th and 15th, but was left stranded both times. The third time was the charm as Satchel delivered another knock in the 17th to score Joe DeMaestri from second for the go-ahead run. After DeMaestri’s second error extended the home 17th, Paige induced a Jackie Jensen pop-up to finish his 5.2 inning win.
| Rk | Player | Age | Date | Tm | Opp | Rslt | PA | AB | R | H | 2B | 3B | HR | RBI | BB | SO | WPA | RE24 | |
|---|---|---|---|---|---|---|---|---|---|---|---|---|---|---|---|---|---|---|---|
| 9 | Mickey McDermott | 31.359 | 1961-04-23 (2) | STL | SFG | W 7-4 | 1 | 1 | 1 | 1 | 1 | 0 | 0 | 3 | 0 | 0 | 0.479 | 2.109 | 7.650 |
9 – Frequent pinch-hitter Mickey McDermott entered this game in that role, delivering a 9th-inning bases-loaded double to score three runs and put the Cards up by two. McDermott stayed in the game to pitch the home 9th, retiring the side in order, including a strikeout of Jim Davenport to end the game.
| Rk | Player | Age | Date | Tm | Opp | Rslt | PA | AB | R | H | 2B | 3B | HR | RBI | BB | SO | WPA | RE24 | |
|---|---|---|---|---|---|---|---|---|---|---|---|---|---|---|---|---|---|---|---|
| 8 | Dave Otto | 28.180 | 1993-05-11 | PIT | PHI | W 8-4 | 3 | 3 | 0 | 2 | 0 | 1 | 0 | 3 | 0 | 0 | 0.482 | 3.423 | 1.943 |
8 – Dave Otto‘s game is the most recent on this list. His two hits, a 2nd inning single and 6th inning triple, both came with two outs and both scored two runs. Despite his heroics, Otto was deprived of a potential win when Paul Wagner relieved him in the home 6th and threw a wild one on his first offering to score Ricky Jordan from third with the tying run.
| Rk | Player | Age | Date | Tm | Opp | Rslt | PA | AB | R | H | 2B | 3B | HR | RBI | BB | SO | WPA | RE24 | |
|---|---|---|---|---|---|---|---|---|---|---|---|---|---|---|---|---|---|---|---|
| 7 | Gene Conley | 29.239 | 1960-07-06 | PHI | MLN | W 8-5 | 1 | 1 | 1 | 1 | 0 | 0 | 1 | 3 | 0 | 0 | 0.485 | 2.688 | 4.360 |
7 – Two-sport star Gene Conley preserved a tie with a clean 9th inning, delivered a two-out, three-run home run in the 10th, and then delivered another 1-2-3 inning in the home 10th for the win, striking out Eddie Mathews and Hank Aaron to end the game.
| Rk | Player | Age | Date | Tm | Opp | Rslt | PA | AB | R | H | 2B | 3B | HR | RBI | BB | SO | WPA | RE24 | |
|---|---|---|---|---|---|---|---|---|---|---|---|---|---|---|---|---|---|---|---|
| 6 | Ken Brett | 20.359 | 1969-09-12 (2) | BOS | NYY | W 4-3 | 3 | 3 | 1 | 3 | 1 | 0 | 1 | 3 | 0 | 0 | 0.488 | 3.135 | 1.287 |
6 – Just days shy of his 21st birthday, Ken Brett delivered a solo home run in the 3rd to open the scoring, and a two-run double in the 7th to put the Red Sox ahead by two. Brett also surrendered all of the Yankee runs, on two home runs by Bobby Murcer.
| Rk | Player | Age | Date | Tm | Opp | Rslt | PA | AB | R | H | 2B | 3B | HR | RBI | BB | SO | WPA | RE24 | |
|---|---|---|---|---|---|---|---|---|---|---|---|---|---|---|---|---|---|---|---|
| 5 | Lew Burdette | 30.264 | 1957-08-13 | MLN | CIN | W 12-4 | 5 | 4 | 3 | 3 | 0 | 0 | 2 | 4 | 1 | 0 | 0.511 | 4.715 | 1.054 |
5 – Lew Burdette homered in the 3rd to pull the Braves within one, singled and scored the go-ahead run in the 5th, and then belted a 3-run HR with the scored tied in the 6th to put the Braves ahead for good.
| Rk | Player | Age | Date | Tm | Opp | Rslt | PA | AB | R | H | 2B | 3B | HR | RBI | BB | SO | WPA | RE24 | |
|---|---|---|---|---|---|---|---|---|---|---|---|---|---|---|---|---|---|---|---|
| 4 | Jack Harshman | 31.073 | 1958-09-23 | BAL | WSH | W 3-2 | 3 | 3 | 2 | 3 | 1 | 0 | 2 | 3 | 0 | 0 | 0.525 | 3.158 | 1.337 |
4 – Jack Harshman went the distance for the win and accounted for all the Oriole runs. His solo shots in the 3rd and 5th innings erased an early 2-0 deficit, and his one-out double in the 7th scored pinch-runner Chuck Oertel from first with the eventual winning run.
| Rk | Player | Age | Date | Tm | Opp | Rslt | PA | AB | R | H | 2B | 3B | HR | RBI | BB | SO | WPA | RE24 | |
|---|---|---|---|---|---|---|---|---|---|---|---|---|---|---|---|---|---|---|---|
| 3 | Dave Hoskins | 27.280 | 1953-05-10 | CLE | SLB | W 12-3 | 3 | 3 | 2 | 2 | 1 | 0 | 1 | 4 | 0 | 0 | 0.582 | 2.955 | 1.317 |
3 – Dave Hoskins pinch-hit for starter Bob Feller in the 7th inning with the Indians trailing 3-0, delivering a one-out double that went for naught when Dale Mitchell lined into a bases-loaded double play to end the frame. Hoskins stayed in to pitch and cranked a 3-run HR in the 8th to tie the game and followed that with an RBI groundout in an 8-run 9th to complete Cleveland’s comeback win.
| Rk | Player | Age | Date | Tm | Opp | Rslt | PA | AB | R | H | 2B | 3B | HR | RBI | BB | SO | WPA | RE24 | |
|---|---|---|---|---|---|---|---|---|---|---|---|---|---|---|---|---|---|---|---|
| 2 | Gerry Arrigo | 25.035 | 1966-07-17 (1) | NYM | HOU | W 4-2 | 3 | 2 | 0 | 2 | 2 | 0 | 0 | 3 | 1 | 0 | 0.629 | 3.139 | 1.582 |
2 – Gerry Arrigo delivered 2-out RBI doubles in the 5th and 7th innings, putting the Mets ahead to stay after an early 2-0 Houston lead.
| Rk | Player | Age | Date | Tm | Opp | Rslt | PA | AB | R | H | 2B | 3B | HR | RBI | BB | SO | WPA | RE24 | |
|---|---|---|---|---|---|---|---|---|---|---|---|---|---|---|---|---|---|---|---|
| 1 | Claude Osteen | 33.052 | 1972-09-30 | LAD | CIN | W 4-2 | 4 | 4 | 0 | 2 | 1 | 0 | 0 | 3 | 0 | 0 | 0.660 | 2.482 | 2.328 |
1 – Claude Osteen went the distance for the Dodgers and provided their key hits with a 2-out RBI single in the 8th to tie the game, and a 2-out two run double in the 10th for the winning runs.
All of the above tables are
Only one of those top 10 games is from the past 40 seasons and, reading the descriptions, it’s not hard to figure out why. Sending up pitchers to pinch-hit for other pitchers? Having pitchers hit for themselves in game situations in late innings? Sure haven’t seen much of that sort of thing in the recent past.
Here are some graphical views of changes in how pitchers have been used as hitters. Note that the numbers shown below are not normalized. Thus:
- The number of teams represented increased in 1961, 1962, 1969, 1977, 1993 and 1998
- Schedule length increased in 1961 (AL) and 1962 (NL). Schedules were reduced in 1972, 1981, 1994 and 1995, owing to labor disruptions.
- The drop-off seen in charts after 1972 is, of course, due to the introduction of the designated hitter rule in the AL
All that being said, the number of teams represented up to 1960 and since 1998 are the same, so, aside from a slight difference in schedule length, the left and right sides of each chart can be compared directly.
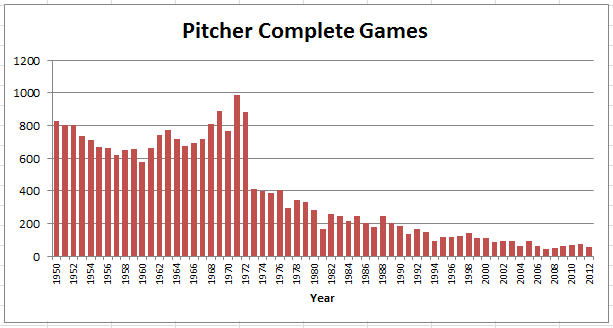
We all know about this one, but still remarkable to see graphically the extent of this change. Note that these are complete hitting games by a pitcher, meaning the pitcher was in the batting order, started and finished the game, and was not removed for a pinch-hitter.
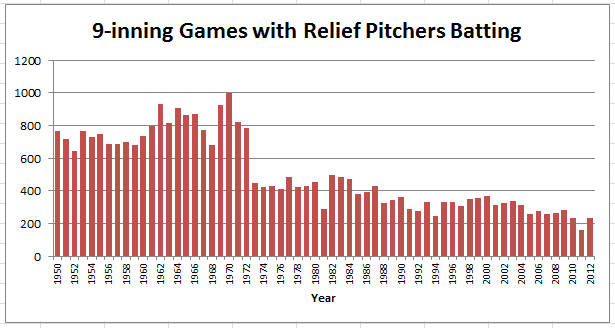
Bearing in mind the preceding chart on complete games, the change represented here is that much more pronounced.
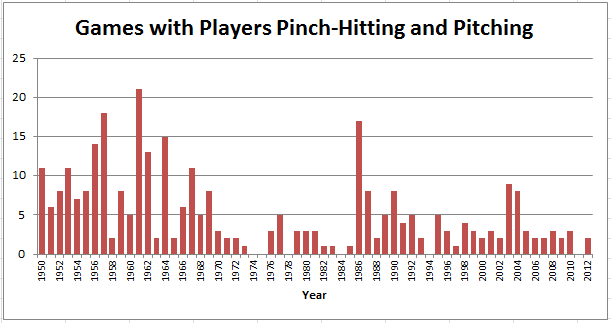
Okay, this has not happened much at any time in this period. But, clearly less common recently than in the 1950s and 1960s. Feel free to offer ideas on what happened in 1986 (were the rosters reduced that year?).
One more, this one showing the tendency for pitchers to hit in high-leverage game situations.
Not as pronounced as I would have expected but, looking at the left and right sides of the chart, certainly more common in the 1950 and 1960s than in the past decade. The recent upward trend in the past decade may be a result of ever larger pitching staffs (and ever shorter benches), forcing managers to let their pitchers hit late in games when a team has gone deep into its bullpen.


