In a recent post looking at pitchers recording higher ratios of unearned to total runs, some commenters wondered about the effect that official scorer bias may have on such results. More specifically, would official scorers be more inclined to score errors on debatable plays when the home team is fielding (thereby protecting the home team’s pitchers’ ERAs), and score hits on similar plays when the home team is batting (thereby enhancing the home team’s batters’ batting stats)?
After the jump, I’ll take a look at this question, and see what the numbers tell us.
Let’s start with average error rates for recent seasons.
So, very consistent each year, averaging about 0.6 errors per game per team, with about a half-error per game difference between the best and worst teams.
That’s the overall summary. What does the picture look like for each team?
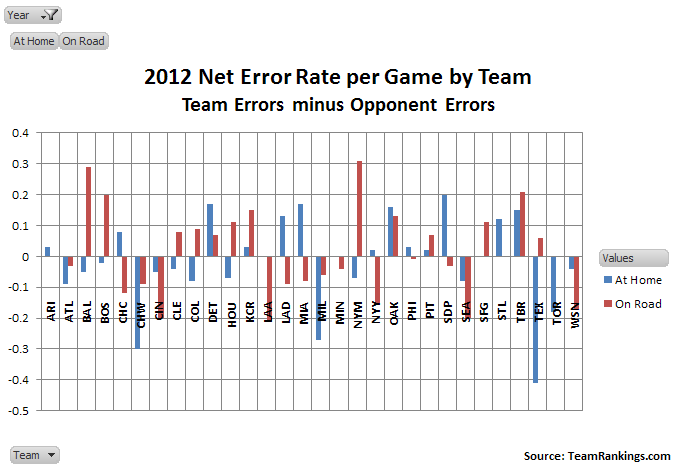
So, what are we seeing here? The chart is showing net errors per game for this season, for each team in its home and away games. Net errors means the team’s errors minus its opponents’ errors. Thus, a bar above the axis line means that team commits more errors than its opponents, and a bar below the line means the team commits fewer errors than its opponents. Bars that appear to be missing indicate the team commits the same amount (or almost the same amount) of errors as its opponents.
Thus, a number of teams have significant differences in their fielding performance relative to their opponents, when playing at home versus on the road. Measured by error differential, the best defensive teams at home are the Rangers, Brewers and White Sox, each more than a quarter of an error per game better than their opponents. On the road, the best defenders are the Reds, Angels and Mariners, each about 0.2 errors per game better than their opponents (despite playing more fielding innings than the home opponent). On the flip side, the worst home defenders are the Padres, Marlins, Tigers and Rays, all at least 0.15 errors per game worse than their opponents. On the road, the worst defensive teams are the Mets, Orioles, Rays and Red Sox, each at least 0.2 errors per game worse than their opponents.
As to the question of official scorer bias, were such bias to be strongly evident we might expect to see teams with much better error rates on the road versus at home. The Angels, Marlins, Dodgers and Cubs best fit that description, each at least 0.2 errors per game better, relative to their opponents, when playing on the road versus at home.
Rather than looking at errors relative to opponents, another avenue of inquiry is simply absolute error rate. In other words, irrespective of its opponents’ performance, does a team commit more errors playing at home or more on the road?
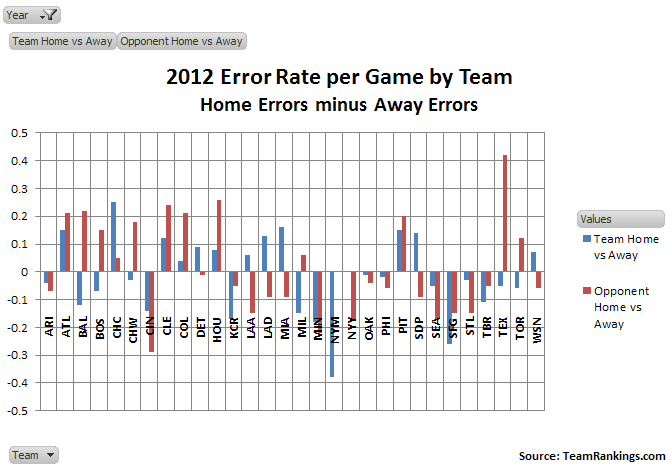
What we’re seeing on this chart is, for 2012, average errors per game at home minus average errors per game on the road, for both the team and its opponents. Thus, a bar above the axis line indicates teams committing more errors at home than on the road, whereas a bar below the axis line means more errors on the road than at home.
The most consistent error rates both home and away are by the teams with small blue bars, irrespective of which side of the axis the bar is on. Thus, the D-Backs, White Sox, Athletics, Phillies, Mariners and Cardinals seem least affected by venue in their defensive play. The reverse are the Mets, Giants, Royals, Brewers and Twins – all much better at home, and the Cubs, Pirates, Padres, Braves and Marlins, all much better away from home. In terms of influencing opponents’ defensive performance (at least, as measured by errors), Texas is the most intimidating venue for a visiting team (not surprising), and Cincinnati the least (definitely surprising).
From this chart, scorers in Arizona, Atlanta, Minnesota, Oakland, Philadelphia and Pittsburgh seem most consistent, scoring both the home and visiting teams at about the same difference relative to scorers in other cities. On the flip side, the Angels, Dodgers, Marlins and Cubs give the strongest indication of scorer bias favorable to home side statistics – the same four clubs identified in the analysis of the previous chart.
Please note that this analysis certainly does not prove or even necessarily suggest conscious bias (of course, unconscious bias always exists, though the form it takes may vary significantly depending on the individual). What can be said is just that, if such conscious bias was found to exist, then these results would be consistent with such a finding.
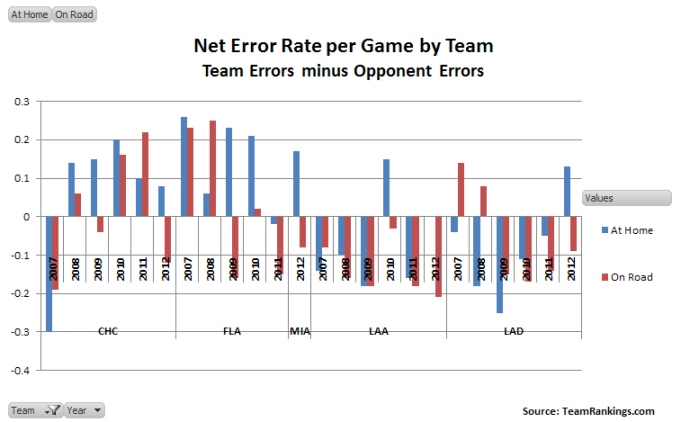
So, let’s look at those same four clubs over a longer time period and see whether the same tendencies persist. First the net error rates, team errors minus opponents’ errors.
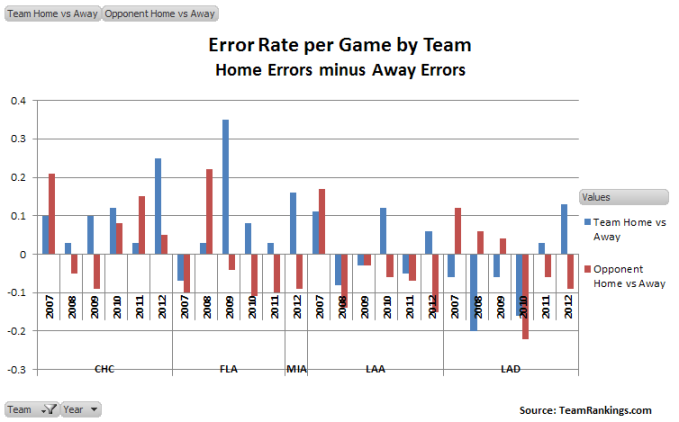
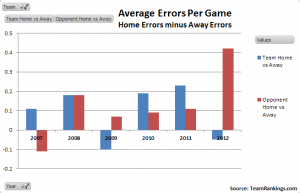
Now, home minus away errors, for the teams and their opponents.
No pattern across years is evident except for Florida/Miami. There, the 2012 pattern is a continuation of a trend started in 2009. Each year since shows noticeably more errors charged against Miami at home, both relative to errors charged to opponents in its home games, and relative to errors charged to Miami when playing on the road.
For those interested who may want to investigate further, these data are available at http://www.teamrankings.com/mlb/stat/errors-per-game. The same or other related data may also be available at other sites.


