Going the way of the dodo: Complete-game losses

Pick any 2012 MLB team. There’s just about a 50-50 chance that that team has a pitcher with a complete-game loss this year. Behold the percentage of all starts that have ended in a CG-loss:
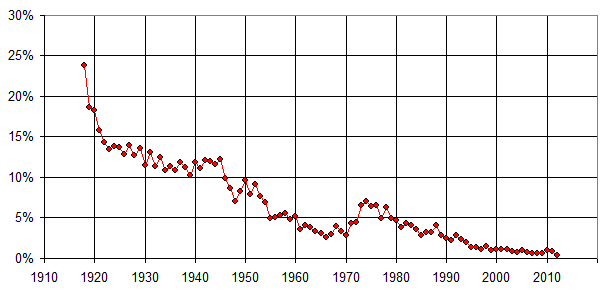
Back in 1918, nearly a quarter of all starts ended in CG losses. That’s because most starts were completed, and a lot of those were on the losing side. It was fairly unusual for a pitcher to get lifted at all.

In 2012, though, the percentage has fallen all the way down to 0.4%, meaning that only about 1 out of every 250 starts ended in a complete game loss. This is the lowest rate in major-league history, even after a bump up in the rate in 2010 and 2011.

One reason why CG losses are so rare is, of course, because complete games themselves are so rare. Only about 3% of all 2012 starts have ended as complete games, just about the lowest rate in history. In 1918, 63% of all starts turned into CGs.

These days, managers follow a pretty strict strategy will bullpens. It’s obvious when they’re ahead–a middle-relief guy in the 7th if needed, then then 8th inning setup guy and the closer for the 9th. But when they are behind, they are just as likely to bring in a middle reliever either mid-inning to try to stem the tide of a rally, or to start the 6th or 7th to prevent a new rally from starting.

Anyway, whenever you see a complete game loss, try to appreciate it. Soon, like the dodo, it may be extinct.

0 0 votes
Article Rating
Subscribe
Notify of
guest

13 Comments
Oldest
Newest Most Voted
Inline Feedbacks
View all comments
oneblankspace
oneblankspace
12 years ago

Or, if they are a National League team, they may lift their pitcher in the 5th or 6th for a pinch hitter to try to get a rally going. American League teams don’t have that motivation.

Dr. Doom
Dr. Doom
12 years ago

And a HUGE percentage of those complete games are no-hitters now, because that’s pretty much the only circumstance a lot of guys get to pitch a CG.

Dr. Doom
Dr. Doom
12 years ago
Reply to  Dr. Doom

Obviously, I don’t mean a majority, or anything like that. I was engaging in hyperbole. I just mean that, historically, the number of CGs ending in a no-hitter MUST be at an all time high, in terms of percentage.

birtelcom
Editor
12 years ago

The number of complete game losses is down this season even as a percentage of all complete games. About 16% of this season’s complete games have been losses, compared to about 26.5% over 2010-2011, 23% over 2000-2009, 24% in the 1990s, 23% in the 1980s and 21% in the 1970s.

Bryan O'Connor
Editor
12 years ago
Reply to  birtelcom

Birtelcom, I think this fits in well with Dr. Doom’s comment at #2. If a pitcher isn’t doing something historic (no-hitter, or at least an efficient shutout), there’s no reason to push him over 120 pitches. Cliff Lee may have 10 K and 0 BB through seven, but if the Phillies are down 2-0, they might as well turn it over to the bullpen.

RJ
RJ
12 years ago
Reply to  Bryan O'Connor

In this case they probably should have let Lee get to 120 pitches: http://www.baseball-reference.com/boxes/SFN/SFN201204180.shtml

Doug
Doug
12 years ago

I remember an earlier post in a similar vein where someone attributed a quote to Bob Gibson to the effect that one of the marks he (Gibson) looked for in a top pitcher was having more complete games than wins, a mark that most definitely is now extinct.

bstar
12 years ago
Reply to  Doug

The last qualifying starting pitcher to have more complete games than wins in a season was Jack Morris in 1989. En route to a 6-14, 4.86 ERA campaign, Morris notched 10 CG, putting his last stamp on a decade in which he proved he just “wanted the ball” more than anyone else.

Seasons with CG > W, for qualifying starters, by decade:

20s – 379
30s – 297
40s – 282
50s – 136
60s – 47
70s – 118
80s – 29
90s – 0
00s – 0
10-12 – 0

Doug
Editor
12 years ago
Reply to  bstar

Thanks, bstar.

So there’s your trivia answer. Good one to remember as unlikely we’ll see the answer change. Morris also had 3 straight seasons (1981-83) with CG >= W.

That’s a curious dip in the 1960s. Was that really 147?

bstar
12 years ago
Reply to  Doug

Ha, Doug i re-checked it last night before posting because I had the same exact thought! Yep, it’s 47. Actually, if you look at Andy’s graph above, you will see a similar dip in the 60s. Weird, I always associated the 60s-70s as the last decades of high CG numbers for SP, when really the 70s were higher with the 60s and 80s being similar.

brp
brp
12 years ago

I’m always a little surprised we don’t see more of these when there are double-headers or when the prior day’s game went long, like 14-15 innings. I do think managers try to stretch the pitcher a bit more in those instances, just god forbid anyone goes past the magical pitch count number.

Because your shoulder and elbow ligaments know how many pitches you’ve thrown, right? And they all are at the same stress and exertion level, no?

topper009
topper009
12 years ago
Reply to  brp

Watching managers leave in struggling guys at 70 pitches or pulling guys who are cruising after 100 is very frustrating.

You do have to wonder what changed since the old days, I have a theory that your arm gets stressed based on time, not repetition, since the old games were much faster guys could throw for 2 hours for a complete game back then but 6 innings today. \

It cant just be “guys were tougher then” That may be a part of it but you cant tough your way through serious arm fatigue and pitch the same.

Doug
Editor
12 years ago

Both starters going the distance is also threatened with extinction.

2000 – 10 games
2001 – 14
2002 – 9
2003 – 8
2004 – 3
2005 – 10
2006 – 4
2007 – 3
2008 – 3
2009 – 7
2010 – 10
2011 – 6
2012 – 2

Last time this happened in the NL was this 2010 game.

This hasn’t happened in the post-season since 1987. Hasn’t happened in the WS since 1968.