In 2011, Blue Jays’ starter Ricky Romero had a breakout season with 6.2 WAR and an All-Star selection, but this year … not so much. Perhaps, another in baseball’s rich history of players who suddenly shine brightly on the biggest stage, then just as quickly fade away, never again to approach that brief flirtation with stardom?
You’ve probably heard that sentiment expressed in various ways and, perhaps, without thinking a great deal about it, presumed there was some measure of truth to it. Well, I’m here to tell you – it ain’t necessarily so. In fact, the true one-year wonder may indeed be about as likely as catching lightning in a bottle.
After the jump, I’ll look more closely at the one-year wonder phenomenon (or non-phenomenon). If you’re like me, I suspect you may be surprised.
Cutting to the chase, here are the one-year wonder hitters.
| Player | Year | WAR | Age | Tm | G | PA | AB | R | H | 2B | 3B | HR | RBI | BB | SO | SB | CS | Pos | |||||
|---|---|---|---|---|---|---|---|---|---|---|---|---|---|---|---|---|---|---|---|---|---|---|---|
| Jacoby Ellsbury | 2011 | 8.0 | 146 | 27 | BOS | 158 | 732 | 660 | 119 | 212 | 46 | 5 | 32 | 105 | 52 | 98 | 39 | 15 | .321 | .376 | .552 | .928 | *8/D |
| Franklin Gutierrez | 2009 | 6.2 | 105 | 26 | SEA | 153 | 629 | 565 | 85 | 160 | 24 | 1 | 18 | 70 | 46 | 122 | 16 | 5 | .283 | .339 | .425 | .764 | *8 |
| Rich Aurilia | 2001 | 6.5 | 146 | 29 | SFG | 156 | 689 | 636 | 114 | 206 | 37 | 5 | 37 | 97 | 47 | 83 | 1 | 3 | .324 | .369 | .572 | .941 | *6 |
| Rick Wilkins | 1993 | 6.5 | 151 | 26 | CHC | 136 | 500 | 446 | 78 | 135 | 23 | 1 | 30 | 73 | 50 | 99 | 2 | 1 | .303 | .376 | .561 | .937 | *2 |
| Billy Grabarkewitz | 1970 | 6.2 | 134 | 24 | LAD | 156 | 640 | 529 | 92 | 153 | 20 | 8 | 17 | 84 | 95 | 149 | 19 | 9 | .289 | .399 | .454 | .852 | *564 |
| Aurelio Rodriguez | 1970 | 6.2 | 102 | 22 | TOT | 159 | 663 | 610 | 70 | 152 | 33 | 7 | 19 | 83 | 40 | 87 | 15 | 6 | .249 | .302 | .420 | .721 | *5/6 |
| Zoilo Versalles | 1965 | 7.1 | 115 | 25 | MIN | 160 | 728 | 666 | 126 | 182 | 45 | 12 | 19 | 77 | 41 | 122 | 27 | 5 | .273 | .319 | .462 | .781 | *6 |
| Bob Cerv | 1958 | 6.1 | 159 | 32 | KCA | 141 | 571 | 515 | 93 | 157 | 20 | 7 | 38 | 104 | 50 | 82 | 3 | 3 | .305 | .371 | .592 | .963 | *7 |
| Eddie Lake | 1945 | 6.3 | 137 | 29 | BOS | 133 | 586 | 473 | 81 | 132 | 27 | 1 | 11 | 51 | 106 | 37 | 9 | 7 | .279 | .412 | .410 | .822 | *6/4 |
Certainly, the names of Versalles and Grabarkewitz on the list have become somewhat synonymous with this topic. Versalles famously parlayed this campaign into an MVP season for the AL champs. Also, I’d be willing to bet the first name on the list won’t be staying there for long. But, that’s all the names there are, back to 1901.
Surely, there must be more than these, you say. Well, here are my criteria – these are the only players since 1901 with careers of 5 or more seasons with exactly one 6+ WAR season and no other 3+ WAR seasons. I chose those definitions since, in most seasons, players will need a least 6 WAR (or more) to make the WAR top 10 for MLB. Similarly, seasons of less than 3 WAR are usually just noise in terms of identifying a season’s top performers, and seldom will attract more than passing attention. Obviously, those criteria can be debated, but I don’t believe they’re terribly unreasonable.
For the pitchers, using the same criteria.
| Player | Year | WAR | Age | Tm | G | GS | CG | SHO | GF | W | L | SV | IP | BB | SO | |||||||
|---|---|---|---|---|---|---|---|---|---|---|---|---|---|---|---|---|---|---|---|---|---|---|
| Joe Mays | 2001 | 6.3 | 1.151 | 4.74 | 2.47 | 1.92 | 25 | MIN | 34 | 34 | 4 | 2 | 0 | 17 | 13 | .567 | 0 | 233.2 | 64 | 123 | 3.16 | 143 |
| Justin Thompson | 1997 | 7.4 | 1.137 | 6.09 | 2.66 | 2.29 | 24 | DET | 32 | 32 | 4 | 0 | 0 | 15 | 11 | .577 | 0 | 223.1 | 66 | 151 | 3.02 | 152 |
| Kevin Tapani | 1991 | 6.6 | 1.086 | 4.98 | 1.48 | 3.38 | 27 | MIN | 34 | 34 | 4 | 1 | 0 | 16 | 9 | .640 | 0 | 244.0 | 40 | 135 | 2.99 | 143 |
| Mark Eichhorn | 1986 | 7.1 | 0.955 | 9.52 | 2.58 | 3.69 | 25 | TOR | 69 | 0 | 0 | 0 | 38 | 14 | 6 | .700 | 10 | 157.0 | 45 | 166 | 1.72 | 246 |
| Mark Fidrych | 1976 | 9.3 | 1.079 | 3.49 | 1.91 | 1.83 | 21 | DET | 31 | 29 | 24 | 4 | 2 | 19 | 9 | .679 | 0 | 250.1 | 53 | 97 | 2.34 | 159 |
| Wayne Twitchell | 1973 | 6.4 | 1.213 | 6.81 | 3.99 | 1.71 | 25 | PHI | 34 | 28 | 10 | 5 | 0 | 13 | 9 | .591 | 0 | 223.1 | 99 | 169 | 2.50 | 152 |
| Jim Merritt | 1967 | 6.2 | 0.993 | 6.36 | 1.19 | 5.37 | 23 | MIN | 37 | 28 | 11 | 4 | 4 | 13 | 7 | .650 | 0 | 227.2 | 30 | 161 | 2.53 | 138 |
| Hank Aguirre | 1962 | 7.2 | 1.051 | 6.50 | 2.71 | 2.40 | 31 | DET | 42 | 22 | 11 | 2 | 13 | 16 | 8 | .667 | 3 | 216.0 | 65 | 156 | 2.21 | 185 |
| Bobby Shantz | 1952 | 8.7 | 1.048 | 4.89 | 2.03 | 2.41 | 26 | PHA | 33 | 33 | 27 | 5 | 0 | 24 | 7 | .774 | 0 | 279.2 | 63 | 152 | 2.48 | 159 |
| Ken Heintzelman | 1949 | 6.0 | 1.328 | 2.34 | 3.35 | 0.70 | 33 | PHI | 33 | 32 | 15 | 5 | 0 | 17 | 10 | .630 | 0 | 250.0 | 93 | 65 | 3.02 | 130 |
| Cy Blanton | 1935 | 7.0 | 1.081 | 5.02 | 1.95 | 2.58 | 26 | PIT | 35 | 30 | 23 | 4 | 3 | 18 | 13 | .581 | 1 | 254.1 | 55 | 142 | 2.58 | 159 |
| Jim Shaw | 1919 | 6.1 | 1.223 | 3.76 | 2.96 | 1.27 | 25 | WSH | 45 | 37 | 23 | 3 | 6 | 17 | 17 | .500 | 5 | 306.2 | 101 | 128 | 2.73 | 117 |
| Lefty Tyler | 1918 | 6.5 | 1.058 | 3.41 | 2.24 | 1.52 | 28 | CHC | 33 | 30 | 22 | 6 | 3 | 19 | 8 | .704 | 1 | 269.1 | 67 | 102 | 2.00 | 138 |
| Ed Karger | 1907 | 6.5 | 1.025 | 3.93 | 1.86 | 2.11 | 24 | STL | 39 | 32 | 29 | 6 | 5 | 15 | 19 | .441 | 1 | 314.0 | 65 | 137 | 2.04 | 123 |
Rather more seasons across a broader range of years. But, still, not a huge number of players. As with the hitters, one MVP season here (Shantz). Also, one WS champion (Tapani). Note that Romero is not on the list as he does not yet have 5 years in the majors.
One interesting sidenote is Jim Merritt, the only liveball era pitcher on this list who garnered no award votes or All-Star recognition for his 6 WAR season. Ironically, Merritt’s 1970 All-Star season when he went 20-12 and finished 4th in the Cy Young (and even got some MVP votes) is, at 1.6 WAR, in the top 10 for lowest WAR in any liveball 20 win season.
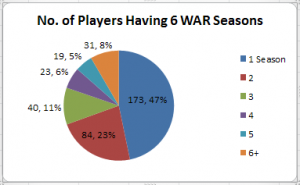
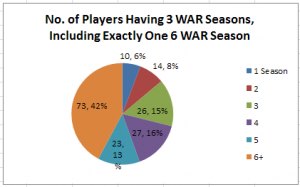
My take from this is simply that cream rises to the top. Thus, a player who is good enough to compile a 6 WAR season is also, in most instances, good enough to also compile at least one other 3 WAR season. This can be seen in the charts below. First, for the hitters.
The chart on the left shows the number of players achieving a 6 WAR season. Of those who do, almost half (47%) achieve only one such season. The right chart is a breakdown of those players with one 6 WAR season, showing how many 3 WAR seasons were compiled. This chart shows that having a 6 WAR season as the only 3 WAR season in a career is the least likely result – only 6% of these players did that, or only about 3% of all players with a 6 WAR season. Far more common is for that one 6 WAR season to be among several 3 WAR seasons. In fact, over 85% of players with exactly one 6 WAR season have at least two other 3 WAR seasons, and over 70% have at least three other 3 WAR seasons.
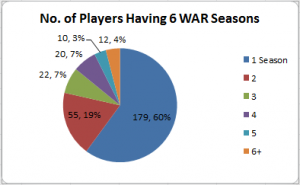
Now, the same measures for the pitchers.
Pretty much the same story as with hitters. Achieving a single 6 WAR season accounts for 60% of all players with 6 WAR seasons. But, for that 60%, having the 6 WAR season be the only 3 WAR season is the least likely scenario, accounting for about 10% of players with one 6 WAR season, or about 6% of all players with 6 WAR seasons.
So, remember, only cream rises to the top. A “fluke” 6 WAR season is a very, very unusual occurrence.


