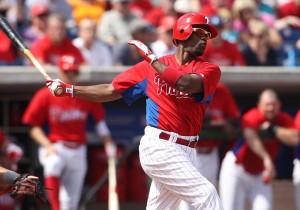
Jimmy Rollins makes a ton of outs.
For starters, here are the NL leaders for outs over the last 11 seasons:
| Player | Out | Year ▴ | Tm | Lg | G | PA | AB | R | Pos | ||||
|---|---|---|---|---|---|---|---|---|---|---|---|---|---|
| Jimmy Rollins | 489 | 2001 | PHI | NL | 158 | 720 | 656 | 97 | .274 | .323 | .419 | .743 | *6 |
| Jimmy Rollins | 508 | 2002 | PHI | NL | 154 | 705 | 637 | 82 | .245 | .306 | .380 | .686 | *6/4 |
| Juan Pierre | 493 | 2003 | FLA | NL | 162 | 747 | 668 | 100 | .305 | .361 | .373 | .734 | *8 |
| Scott Podsednik | 504 | 2004 | MIL | NL | 154 | 713 | 640 | 85 | .244 | .313 | .364 | .677 | *8 |
| Jose Reyes | 528 | 2005 | NYM | NL | 161 | 733 | 696 | 99 | .273 | .300 | .386 | .687 | *6 |
| Juan Pierre | 521 | 2006 | CHC | NL | 162 | 750 | 699 | 87 | .292 | .330 | .388 | .717 | *8 |
| Jimmy Rollins | 521 | 2007 | PHI | NL | 162 | 778 | 716 | 139 | .296 | .344 | .531 | .875 | *6 |
| Jose Reyes | 508 | 2008 | NYM | NL | 159 | 763 | 688 | 113 | .297 | .358 | .475 | .833 | *6 |
| Jimmy Rollins | 519 | 2009 | PHI | NL | 155 | 725 | 672 | 100 | .250 | .296 | .423 | .719 | *6 |
| Rickie Weeks | 485 | 2010 | MIL | NL | 160 | 754 | 651 | 112 | .269 | .366 | .464 | .830 | *4/D |
| Starlin Castro | 496 | 2011 | CHC | NL | 158 | 715 | 674 | 91 | .307 | .341 | .432 | .773 | *6 |
Rollins has led in 4 of those 11 years. To be fair, he also led in AB all of those years so he had the most opportunity to make outs. (Although, to play devil’s advocate, if he had walked more, he wouldn’t have had so many ABs…)
But this isn’t the whole story–click through for more.
Since 2001, here are the players with at least 5000 PA whose out total was at least 65% of his AB total:
| Rk | Out | AB | PA | G | R | HR | RBI | BB | SO | Pos | Tm | |||||
|---|---|---|---|---|---|---|---|---|---|---|---|---|---|---|---|---|
| 1 | Albert Pujols | 4506 | 6312 | 7433 | 1705 | 1291 | 445 | 1329 | 975 | 704 | .328 | .420 | .617 | 1.037 | *375/9D64 | STL |
| 2 | Lance Berkman | 4102 | 5602 | 6777 | 1589 | 1012 | 332 | 1102 | 1064 | 1120 | .298 | .413 | .551 | .963 | 3798/D | HOU-STL |
| 3 | Todd Helton | 3924 | 5544 | 6678 | 1548 | 986 | 240 | 940 | 1024 | 841 | .319 | .424 | .534 | .958 | *3/D | COL |
| 4 | Chipper Jones | 3728 | 5128 | 6094 | 1452 | 901 | 265 | 926 | 901 | 831 | .305 | .406 | .531 | .937 | *57/D6 | ATL |
| 5 | Adam Dunn | 3825 | 4975 | 6065 | 1448 | 865 | 354 | 880 | 990 | 1632 | .250 | .381 | .521 | .902 | *739/D | CIN-TOT-WSN |
| 6 | Derrek Lee | 4044 | 5425 | 6241 | 1466 | 880 | 268 | 869 | 713 | 1202 | .291 | .376 | .514 | .890 | *3/D | FLA-CHC-TOT-PIT |
| 7 | Brian Giles | 3419 | 4590 | 5488 | 1251 | 751 | 174 | 683 | 819 | 547 | .286 | .395 | .482 | .877 | *978 | PIT-TOT-SDP |
| 8 | Aramis Ramirez | 4250 | 5732 | 6345 | 1520 | 829 | 303 | 1056 | 467 | 841 | .289 | .347 | .513 | .860 | *5/D | PIT-TOT-CHC |
| 9 | Pat Burrell | 3529 | 4599 | 5474 | 1383 | 656 | 258 | 820 | 802 | 1278 | .256 | .367 | .485 | .852 | *7/D | PHI-SFG |
| 10 | Jimmy Rollins | 5129 | 6805 | 7482 | 1622 | 1075 | 170 | 720 | 566 | 849 | .272 | .329 | .433 | .762 | *6/4D | PHI |
| 11 | Rafael Furcal | 4109 | 5510 | 6127 | 1353 | 903 | 104 | 499 | 524 | 766 | .281 | .344 | .410 | .754 | *6/4 | ATL-LAD-TOT |
| 12 | Juan Pierre | 3948 | 5333 | 5847 | 1382 | 778 | 13 | 367 | 327 | 322 | .300 | .347 | .374 | .722 | *87/D | COL-FLA-CHC-LAD |
There’s our man, Rollins, with the worst OPS out of the group save two players who even worse. Maybe the Phillies should go out and sign Juan Pierre too….OH WAIT–THEY ALREADY DID!
Seriously, it’s OK for players to have outs that are 75% of their AB title when they get on base like Chipper or Helton, or slug like Pujols or Berkman.
But Rollins, who has the lowest OBP of this group yet inexplicably bats leadoff…all I can say is “man, oh man…”

