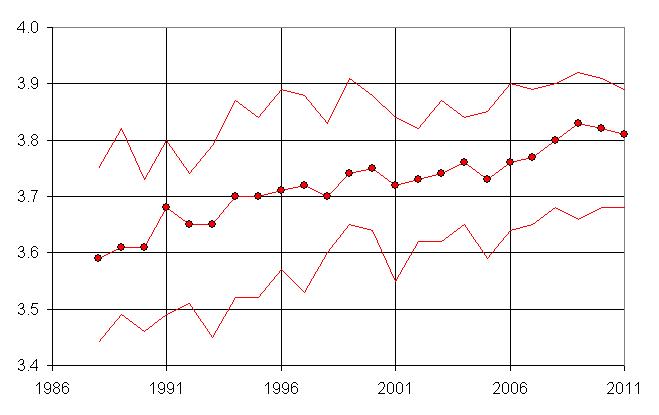
Here’s a plot showing the average pitches per plate appearance across all of MLB going back to 1988:
Click through for discussion.
Why 1988? That’s as far back as Baseball-Reference.com has complete pitch data.
The graph above shows the average number of pitches (the circles) as well as the average for the team with highest and lowest values for each season (the undotted lines).
What does this mean? Why does this happen? I don’t think have definitive answers, but here is some food for thought:
- There is a strong correlation between the number of pitches per plate appearance and the rate of batters striking out. The more pitches a batter sees, the more often he gets to a 2-strike count, and the more often he ultimately strikes out. Think of it this way–if a batter swung on both the first and second pitches of every at-bat, he’d rarely strike out because he’d put the ball in play a lot.
- It’s possible that this is a sort of Moneyball effect, with patience in working the count becoming more prevalent across baseball. I tend to doubt this, though, as walks haven’t changed much over the last 20-some years.
- Systematic changes in umpiring could be involved, although I don’t see how.
The one thing that does make sense to me is that pitches per plate appearance correlates with both the total innings pitched and total appearances by relievers. We know that from the late 1980s until the late 2010s, duration of starts got shorter and shorter, meaning that relievers pitched more, on average, in each game. We also know that specialists such as the LOOGY have become more and more prevalent. These trends have started to reverse a bit in the last few years.
I think it’s likely that starting pitchers are much more conscious of pitch counts than relievers. A starter knows that he won’t have the gas to pitch the 7th inning if he’s reached 100 pitches through 5 innings, and this may make him more likely to throw “out” pitches, such as those trying to induce a swing and a weak grounder, as opposed to trying to really work a batter and ultimately strike him out.
Relievers, on the other hand, have no such limitations. Again think of the LOOGY in the extreme case–this is a Lefty One Out GuY who knows he’s only going to face one batter. After he’s thrown maybe 30 warm-up pitches in the bullpen and a few more on the mound, what difference does it make to him if he throws 2, 3, 5, or 7 pitches to the batter? He might as well be as crafty as possible, and if that means nibbling and throwing lots of pitches, so be it.
This effect is minor, but these days it might be multiplied for 3or 4 relievers who are pitching a total of 3 innings, whereas in 1988 it might have been 2 relievers pitching a total of 2 innings. That’s a lot of batters over the course of a season, so even a small effect can show up as a 5% difference over an entire year.

