Normalized strikeout rates of the all-time greats

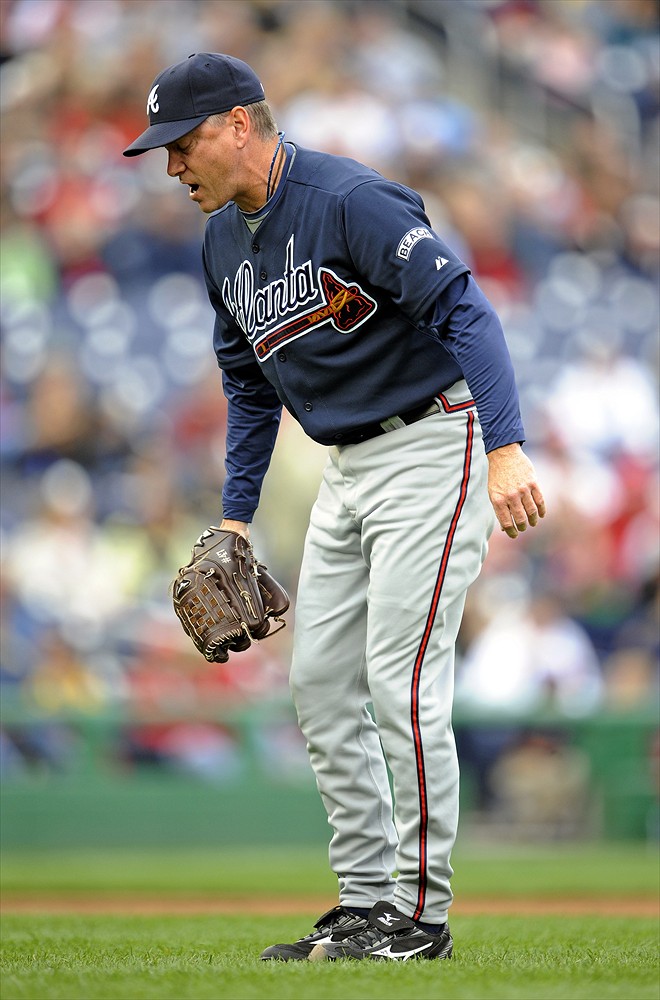
Tom Glavine feeling the pain / Icon SMI

As strikeouts have become so much more frequent than they used to be, it’s useful to gain a little perspective on how the K rates of some of the best pitchers compare to the typical rates of their own era.

We know that guys like Tom Glavine and Greg Maddux were not strikeout artists, instead using fantastic control to position pitches precisely and (more often than not) induce weak ground or fly balls.

But how do these guys compare to others?

Click through to find out.

I took the 28 pitchers to amass 4000 innings pitched since 1901. This is obviously not an all-inclusive list of the best pitchers ever, but it seemed like a good place to start this analysis. For each pitcher, I took an MLB-wide number for average K/9, taking it from the midpoint year of each guy’s career. Of course it would be more precise to do a weighted year-by-year average for each player, but this quick and dirty method probably yields fairly similar results.

Player            K/9      normalized K/9
Ted Lyons         2.32     0.73
Tom Glavine       5.32     0.81
Jamie Moyer       5.38     0.82
Tommy John        4.29     0.89
Greg Maddux       6.06     0.90
Jim Kaat          4.89     0.91
Robin Roberts     4.52     0.94
Eppa Rixey        2.70     0.96
Warren Spahn      4.43     1.05
Gaylord Perry     5.95     1.10
Red Faber         3.24     1.12
Frank Tanana      5.96     1.15
Phil Niekro       5.57     1.16
Burleigh Grimes   3.26     1.16
Don Sutton        6.09     1.17
Early Wynn        4.60     1.21
Red Ruffing       4.12     1.21
Eddie Plank       4.50     1.22
Christy Mathewson 4.72     1.28
Fergie Jenkins    6.38     1.28
Roger Clemens     8.55     1.32
Tom Seaver        6.85     1.32
Pete Alexander    3.81     1.36
Steve Carlton     7.13     1.37
Bert Blyleven     6.70     1.43
Walter Johnson    5.34     1.53
Randy Johnson    10.61     1.63
Nolan Ryan        9.55     1.99

The first number is each pitcher’s raw career K per 9 innings, and the second number is his K/9 divided by the league-wide number I described above.

So Glavine, Maddux, and Tommy John are the most recent pitchers to reach the 4,000 innings mark while having a below-average K rate. It just doesn’t happen all that often.

It comes as no surprise to see Nolan Ryan at the other end, with a K rate nearly double the league for his career. All of the other tip strikeout pitchers with 4,000 innings are at the high end, as well. (And I love any list that ends up with Walter Johnson and Randy Johnson next to each other.)

0 0 votes
Article Rating
Subscribe
Notify of
guest

53 Comments
Oldest
Newest Most Voted
Inline Feedbacks
View all comments
Bells
Bells
12 years ago

And if Bert Blyleven didn’t make the ballot last year, this would be more fuel to the fire of his continued non-HoF selection. Geez, how did the guy wait 15 years? Look at that company.

John Autin
Editor
12 years ago

Good info, Andy.

It’s too bad that B-R doesn’t provide the same comparatives for pitchers that it does for hitters. On a hitter’s Batting page, the year-by-year league-wide BA, OBP, SLG and OPS numbers are provided next to the player’s own marks. No such data is presented for pitchers in any category.

Dr. Doom
Dr. Doom
12 years ago
Reply to  John Autin

I was actually wishing for that just yesterday. It seems like it would be easy enough to implement, and really, really helpful for stuff like this.

topper009
topper009
12 years ago
Reply to  John Autin

They have it as an option on Fangraphs, you can click “Show Averages” in the advanced tab on a players page.

John Autin
Editor
12 years ago

Some might be surprised at how big an effect normalization has on some head-to-head comparisons. For instance, Randy Johnson’s SO/9 was almost twice that of Walter Johnson, but their normalized rates are very similar.

topper009
topper009
12 years ago

Wasn’t Dazzy Vance the king of this? He only pitched 2966.2 innings, starting at age 31 in 1922, but…

Dazzy Vance 6.2 2.09

Lawrence Azrin
Lawrence Azrin
12 years ago
Reply to  topper009

I agree – I realize that they are well short of the 4,000 IP cut-off, but the first two names I thought of when I saw this article were: – Dazzy Vance – Rube Waddell for being high-K pitchers, in low-K eras. Also, I was surprised to see Robin Roberts rank as below league-average; he had a reputation as a very hard thrower, and was in the Top-10 in K’s nine straight years (1950-58). Looking further, however, he was in the Top-10 in K/9 innings only four times, and his actual K totals aren’t that high (never greater than 200).… Read more »

Todd
Todd
12 years ago
Reply to  Lawrence Azrin

Roberts had one of the best fastballs of his (or any other) era, better than most of the pitchers on this list. His relatively low ranking here is the result of his “put it over the plate and see what happens” approach to pitching. This pitching philosophy also resulted in high IP and HR totals. He was hardly a soft-tossing finesse guy like most of the lower normalized rate guys were.

John Autin
Editor
12 years ago
Reply to  topper009

Good point, Topper.

MLB SO/9 leaders:
1924 — Vance 7.65, W.Johnson 5.12, Shawkey 4.94
1925 — Vance 7.50, Grove 5.30, Luque 4.33
1926 — Vance 7.46, Grove 6.77, Jakie May 5.53

1922-32 combined:
Vance, 6.28
Avg. of other 89 pitchers with 1,000+ IP — 3.01

Voomo Zanzibar
Voomo Zanzibar
12 years ago

How did Ted Lyons get ’em out with that junk? 🙂

At the end of his career, he pitched only on Sundays (Sunday Teddy).
In fact, in 1942, at age 41, he led the league in era (2.10, 171+) while pitching the first game of a Sunday doubleheader in 14 of his 20 starts, completing all of them.

Morten Jonsson
Morten Jonsson
12 years ago

Very interesting. One thing that stands out is how few of the 4000-inning pitchers had a below-average strikeout rate. You’d think the soft-tossers would last longer, but obviously they don’t. More about Dazzy Vance–he didn’t really get started until his thirties, which makes those strikeout rates even more amazing. He led the league in K/9 when he was 40. Dazzy Vance was the Nolan Ryan of his time. And between the majors and the minors, he probably pitched over 5000 innings in his career. Other notable strikeout pitchers with long careers who don’t quite make the cutoff are Lefty Grove,… Read more »

John Autin
Editor
12 years ago
Reply to  Morten Jonsson

” You’d think the soft-tossers would last longer, but obviously they don’t.”

This is an important point. It might still be true that a high-strikeout approach to pitching is more stressful on the arm than “pitching to contact” — but any such effects are greatly outweighed by the fact that high-K pitchers simply get better results, on average. Strikeout rates tend to decline after a certain age, for all types of pitchers; those whose K rates started high have longer to go before their results fall below replacement level.

Morten Jonsson
Morten Jonsson
12 years ago
Reply to  John Autin

I think that’s true, but it still of course leaves a lot of questions. Why is it, for one thing, that many high-strikeout pitchers (Seaver, for instance, or Feller) can continue to be effective late in their careers when their strikeout rates are only about league average? Are they just the exceptional ones who learned to pitch a completely different way? And you also seem to be assuming that junkball pitchers lose their arm strength to the same degree flamethrowers do. And I’m not sure that’s the case. If you didn’t have that much at 25–if your game is keeping… Read more »

John Autin
Editor
12 years ago
Reply to  Morten Jonsson

I’m actually not making any assumptions about anyone losing arm strength. I’m just saying that any group of pitchers, whatever their defining characteristics, will see a decline in K rate after a certain age. After all, it’s not just strength that declines with age; fine motor control does the same. Whatever the pitch, it’s harder to execute successfully at age 35 than it is at 25. And I wouldn’t be so quick to describe low-K pitchers as junkballers (with the corresponding implication that high-K pitchers are fireballers). There are many pitchers who throw hard, but just don’t miss bats. (If… Read more »

Morten Jonsson
Morten Jonsson
12 years ago
Reply to  John Autin

Yes, “junkballers” was just lazy shorthand for a pitcher who doesn’t strike out a lot of batters. There are actually a lot of ways of getting the job done, as you point out.

And point taken about there being other physical factors than arm strength that play into it in someone’s thirties and forties. I’m old enough to testify to that. Cy Young claimed that he never lost his fastball, he just got too fat to chase bunts.

Hartvig
Hartvig
12 years ago
Reply to  Morten Jonsson

Bill James wrote something about this in one of his Historical Baseball Abstracts when writing about Mark Fidrych. What he found basically was that going back to post-WWII only Lew Burdette had a successful relatively long major league career as a starter with a strikeout rate much below 4.5 SO/9 IP. He was rebutting some guys claim that if Fidrych had not hurt his arm he would have won something like 320 games in his career. There have been guys like Andy Hawkins & Allan Anderson & a few others who may have been successful for a season or two… Read more »

John Autin
Editor
12 years ago
Reply to  Hartvig

Grrr … James’s Fidrych essay (“Bird, Thou Never Wert”) is seared into my brain, since I thought it was one of his lazier efforts. He paid no attention to the facts that (a) there are outliers who succeed for many years with low K rates relative to the league, and (b) Fidrych had all of the characteristics of those guys — fantastic control, high GB/FB ratio, minuscule HR and XBH rate (thanks to all the grounders), cuts off the running game, fields his position well. It may be harder to maintain success that way, and maybe the Bird wasn’t destined… Read more »

Hartvig
Hartvig
12 years ago
Reply to  John Autin

I’m inclined to side with you on Fidrych. Even if he allowed a few more hits as time went on what you say about his peripherals is all true plus his strikeout rates in the minors and even in the majors after he got hurt we all higher than what he did in his one fantastic season. He probably would never had another season like ’76 (how many pitchers do?) but I think he could have been successful for several more seasons. I was kind of hoping this offseason that maybe someone still thought highly enough of Porcello to trade… Read more »

Ed
Ed
12 years ago
Reply to  Hartvig

Two things: 1) John…who are the outliers who have succeeded for a long time with K rates below league average? Just curious. 2) Actually I don’t think Fidrych gets enough credit for his ’76 season. Pitchers like Fidrych normally need a strong defense to be successful. Well the Tigers defense in ’76 was horrible. Their team dWAR was -5.4. Of the 17 players with more than 100 PAs, 12 had negative dWAR, 4 positive and one 0. No one had a dWAR higher than 0.4(btw, most of the players that we associate with the late 70s, early 80’s Tigers weren’t… Read more »

John Autin
Editor
12 years ago
Reply to  Hartvig

Ed @34 (1) — Dang, I hoped no one would ask that question! OK, let’s see. Fidrych pitched 1 full year and parts of 2 others before his arm was fully wrecked. For those 3 seasons, totaling 353 IP, the weighted average of his K rate was 80% of the league average. So that’s what I have to match. I’ll look for pitchers with at least 1,000 IP and ERA+ at least 115, and only from 1946-present. — Eddie Lopat, 1946-55, 122 ERA+ in 2,030 IP, 3.15 SO/9 was 80% of league average. — Mark Buehrle, 2000-11, 120 ERA+ in… Read more »

Doug
Doug
12 years ago
Reply to  Hartvig

Ed, Re: Outliers Mark Buehrle has the lowest K/9 rate (5.07) for active pitchers with careers of 2000 IP and 105 ERA+. Only other recent guys (since 2000) with K/9 under 5.5 are Mike Hampton (5.50), Tom Glavine (5.32), Kenny Rogers (5.36), and Brad Radke (5.39). Selected earlier pitchers that fit this model: Dennis Martinez, 106 ERA+, 4.84 K/9 Charlie Liebrandt, 109 ERA+, 4.37 K/9 Tommy John, 111 ERA+, 4.29 K/9 Larry Gura, 106 ERA+, 3.52 K/9 Mel Stottlemyre, 112 ERA+, 4.25 K/9 Jim Perry, 106 ERA+, 4.3 K/9 Ned Garver, 113 ERA+, 3.2 K/9 Bob Lemon, 119 ERA+, 4.0… Read more »

Ed
Ed
12 years ago
Reply to  Hartvig

Now John you can’t just make statements like that and not expect the follow-up question. 🙂

Anyway, as I said I think it’s remarkable how well he pitched in ’76 behind that defense. Would have been interesting to see what he could have done once the Tigers improved their defense via Trammell, Whitaker, Parrish, Lemon, Herndon, Gibson, etc.

kds
kds
12 years ago
Reply to  Hartvig

One part of Bill James’ doubt that Fidrych could continue to be successful with the low K rate was that Tommy John specifically, and maybe others, had higher than average K rates early in their careers which then dropped towards their low average rate. The Bird was starting off very low. His BABiP was .247 that year, compared to the Tigers .281 overall and the AL .271. It’s likely that the difference in his favor is luck, not skill and would probably regress towards the mean. Adding 13 – 20 runs to those he actually allowed. Knuckleball pitchers are known… Read more »

John Autin
Editor
12 years ago
Reply to  Hartvig

kds @44 — The weakness of James’s argument is that it’s entirely based on one season, a rookie year of 29 starts at age 21. It’s not uncommon for a pitcher’s SO rate to climb after his first full year. Here are some recent, prominent examples: – Justin Verlander averaged a subpar 6.0 SO/9 in his first full season (AL avg. was 6.4). Many articles were written that he couldn’t sustain his success with so few Ks. Maybe not — but he cranked up the K rate the next year. – Trevor Cahill had 4.5 SO/9 in his rookie year,… Read more »

John Autin
Editor
12 years ago
Reply to  Hartvig

A few more low-K, moderately successful pitchers of the past 20 years: — Aaron Cook, 3.8 SO/9, 106 ERA+ in 1,312 IP, including 6 straight years of 113+ ERA+ without ever topping 4.4 SO/9. — Chien-Ming Wang, 4.1 SO/9, 107 ERA+ in 733 IP, with 2 qualifying years of ERA+ over 120. — Dennis Martinez’s 3rd act. For his last 11 years combined (1988-98), El Presidente had a 122 ERA+ with 5.2 SO/9, against a MLB average of 6.0 (87%). — Kenny Rogers as a SP. From 1993-2008, Rogers had a 108 ERA+ in 2,943 IP with 5.2 SO/9, against… Read more »

Doug
Doug
12 years ago
Reply to  Hartvig

A morsel of Lew Burdette trivia.

He and Warren Spahn faced each other Aug 31, 1965, each logging a CG as the Phillies beat the Giants 2-0 on a pair of solo shots by Alex Johnson and (of all people) Bobby Wine. By combined age, Spahn and Burdette are the oldest pair of pitchers to accomplish this feat.

http://www.baseball-reference.com/boxes/PHI/PHI196508312.shtml

John Autin
Editor
12 years ago
Reply to  Doug

Cool. I see that Spahn had 5 career CG losses allowing at least 2 runs and HR=Runs. Another came earlier that year, pitching for the Mets against Drysdale and the Dogers, losing 2-1 on HRs by Drysdale and Roseboro. On 8/30/62, Spahn lost to Jack Sanford, 3-2, allowing HRs to Mays, Cepeda and Davenport (the first two back-to-back). The Braves’ runs also came on solo HRs, by Spahn and Frank Bolling. That makes it one of 3 known games in which both teams scored 2+ runs all on solo HRs. All three were 3-2 games. Another of the Spahn losses… Read more »

Doug
Doug
12 years ago
Reply to  John Autin

Spahn’s next CG after the Burdette game (and the last CG of Spahn’s career) was a 9-2 win over the Cubs on Sep 12, 1965. The two runs Spahn allowed were on a pair of solo shots by John Boccabella.

Doug
Doug
12 years ago
Reply to  John Autin

Spahn is the all-time leader in CGs (W or L)with R=HR, doing this 45 times. He’s followed by Roberts (36), Jenkins (32), and Kaat, Bunning, Marichal and Palmer, all at 25.

Jeff Allen
Jeff Allen
12 years ago

Absolutely fascinating stuff. I’ve been working on a project for about a year now where I’m creating all-star teams based on place of birth (Ex. a team of Floridians, a team of Venezuelans, etc.) and that involves a LOT of comparisons between players from different eras. K-rate has always been one of the most difficult stats to compare, simply because I didn’t have a normalized rate to compare against. I’ll definitely have to start using this for the 16 or so teams I have left.

Hartvig
Hartvig
12 years ago
Reply to  Jeff Allen

You’re not going to have a lot to work with when you get to where I’m from- North Dakota.

Jeff Allen
Jeff Allen
12 years ago
Reply to  Hartvig

ND was lumped in with SD, MT, ID, WY, and (believe it or not) Alaska. I believe Pronk, Erstad, and Rich Helling all made the final team of 25.

Hartvig
Hartvig
12 years ago
Reply to  Jeff Allen

I knew Helling’s older sister in high school & my best friend even dated her a few times. He decided to stop when her dad caught a another guy trying to sneak into her room at night and took after him with a shotgun.

kds
kds
12 years ago

Fun stuff, but a few comments on methodology. K% (K/PA) is a better measure. K/9 rates pitchers higher if they have given themselves more opportunities by allowing more base runners. I guess b-ref doesn’t make it easy to figure a weighted league average for a pitchers career (weighted by batters faced each year), but that would be the better way to do this. Both of these changes would help Maddux.

Doug
Doug
12 years ago
Reply to  kds

Here’s the same guys, sorted by Batters Faced per K.

Randy Johnson, 3.5
Nolan Ryan, 4.0
Roger Clemens, 4.3
Steve Carlton, 5.2
Tom Seaver, 5.3
Bert Blyleven, 5.5
Fergie Jenkins, 5.8
Don Sutton, 6.1
Greg Maddux, 6.1
Gaylord Perry, 6.2
Frank Tanana, 6.4
Walter Johnson, 6.7
Phil Niekro, 6.8
Jamie Moyer, 7.1
Tom Glavine, 7.1
Christy Mathewson, 7.5
Jim Kaat, 7.7
Eddie Plank, 7.9
Robin Roberts, 8.1
Early Wynn, 8.3
Warren Spahn, 8.3
Tommy John, 8.8
Red Ruffing, 9.3
Pete Alexander, 9.5
Red Faber, 11.6
Burleigh Grimes, 11.9
Eppa Rixey, 13.9
Ted Lyons, 16.6

topper009
topper009
12 years ago

Pitchers with 100+ more Ks than the 2nd place guy, across both leagues:

125, Nolan Ryan 383 – Bert Blyleven 258, 1973
118, Nolan Ryan 367 – Bert Blyleven 249, 1974
110, Rube Waddell 349 – Jack Chesbro 239, 1904
104, Dazzy Vance 262 – Walter Johnson 158, 1924
101, Amos Rusie 208 – Brickyard Kennedy 107, 1893 (first year of the 60’6″ mound)

Morten Jonsson
Morten Jonsson
12 years ago
Reply to  topper009

My older sister went to school with Brickyard Kennedy! A pretty rough guy, but really charming once you got to know him, she says. Of course, I think he was sweet on her, as they used to say. A lot of guys were. I’ll have to tell her he made it as a baseball player.

Jeff Allen
Jeff Allen
12 years ago
Reply to  Morten Jonsson

You sure that wasn’t D’Brickashaw Ferguson?

Lawrence Azrin
Lawrence Azrin
12 years ago
Reply to  topper009

In 1924 Dazzy Vance had his biggest strikeout year (262), with well more than the #2 and #3 NL leaders put together. Only four other pitchers in MLB (one in the NL) even had more than 100 K’s. He had one out of every 13 strikeouts in the entire NL.

Even though Vance’s 1924 season does not rank that high up on the single-season leaderboards (tied for 130th all-time), I submit that this is one of the greatest strikeout sesaons ever. His domination of pitcher strikeouts that year was – dare I say it? – Ruthian.

Voomo Zanzibar
Voomo Zanzibar
12 years ago
Reply to  Lawrence Azrin

Vance also had more than twice the pitcher’s WAR in ’24 than the next guy:

9.1 – 4.5

Lawrence Azrin
Lawrence Azrin
12 years ago
Reply to  Voomo Zanzibar

Vance won the 1924 NL MVP award, which was somewhat controversial then since Hornsby had one of the greatest batting seasons ever with his .424 BA (12th all-time in Adjusted Batting Runs),and finished second. B-R has Hornsby ahead 13.0 to 8.8 on WAR. Somewhat related anecdote from the all-time classic book of baseball interviews, “The Glory Of Their Times”: “You couldn’t hit him on a Monday. He cut the sleeve of his undershirt to the elbow. And on that part of it he used lye to make it white and the rest he didn’t care how dirty it was. Then… Read more »

John Autin
Editor
12 years ago
Reply to  Lawrence Azrin

I love that story; I did not know about the tracer.

Isn’t it odd that Monday was washing day, when Sunday & Saturday were the days that most folks needed to have their best clothes clean for church or synagogue? Why not wash on Friday? But there’s probably some other reason I’m not thinking of.

John Autin
Editor
12 years ago
Reply to  Lawrence Azrin

Vance’s career-best 17-SO game came on a Monday, July 20, 1925, in Brooklyn. He also homered among his 3 hits, and drove in the first 3 runs in a 4-3 win.

The pitcher he beat that day was Duster Mails, the guy who came out of nowhere to go 7-0 all in September and help Cleveland capture the 1920 pennant.

John Autin
Editor
12 years ago
Reply to  Lawrence Azrin

I’m bidding for a Vance-like lead in total comments. 🙂

Lawrence Azrin
Lawrence Azrin
12 years ago
Reply to  John Autin

So you are saying you would like to make more comments than Andy and Ed put together? You’re not that far away.

Ed
Ed
12 years ago
Reply to  Lawrence Azrin

I used to have a stranglehold on 2nd place behind Andy. Then John came out of nowhere and blew past both of us.

Doug
Doug
12 years ago
Reply to  topper009

In 1940, almost had a 100 K gap between #1 and #2 – Feller, 261. Newsom, 164. In 1946, there was a 100 K gap between the #2 and #3 guys. – Feller, 348 – Newhouser, 275 – Hughson, 172 Feller and Newhouser together had more Ks than #3 through #6 combined. From 1942 to 1954 (13 seasons), the MLB leader was under 200 Ks 11 times, at 212 once (Newhouse, 1945), and then this season with two guys over 275. Seems it took a while for the hitters returning from the war to get their timing back. Either Vance… Read more »

Luis Gomez
Luis Gomez
12 years ago

This is a test.

John Autin
Editor
12 years ago

Personal tangent / technical cry for help: Something from the site b.scorecardresearch.com is stopping pages from fully loading. Does anyone out there have experience with this monster and the technical know-how to tell me how to kill it? I am using Google Chrome. I’ve found many comments from people suffering this problem, and I’ve taken their suggestions — going to the company’s website and “opting out” (yeah, right); blocking all third-party cookies; clearing the cache. But nothing is working for me, and I’m not savvy enough to go any further without specific instructions. Here are a couple of the comments… Read more »

Andy
12 years ago

I have developed a vastly-improved version of this post but I got sidetracked by the email problem. I’ll get it posted tonight or tomorrow morning.

Dr. Doom
Dr. Doom
12 years ago
Reply to  Andy

Vastly improved, eh? Can’t wait to see it.

trackback

[…] found a straightforward way to redo the normalized strikeout rate study. Check out my previous post on the subject for the […]