In 2011, there were 185,245 plate appearances and 34,488 strikeouts, meaning that 18.6% of PAs resulted in strikeouts. This number is obviously the same whether you look at it from the batters’ standpoint or the pitchers’–both groups averaged the same 18.6% strikeout rate.
Among batters, though, we know there is a large variation in strikeouts. Among those who qualified for the batting title, Drew Stubbs (205) and Mark Reynolds (196) led the way while Juan Pierre (41) and Jose Reyes (41) had the fewest. That range of a factor of 5 is larger than that of pitchers. Among starters who qualified for the ERA title, Justin Verlander (250) and Clayton Kershaw (248) had the most while Brad Penny (74) and Josh Tomlin (89) brought up the rear. (Penny and Tomlin also pitched many fewer innings, and their K/9 rates were even closer to the leaders’.)
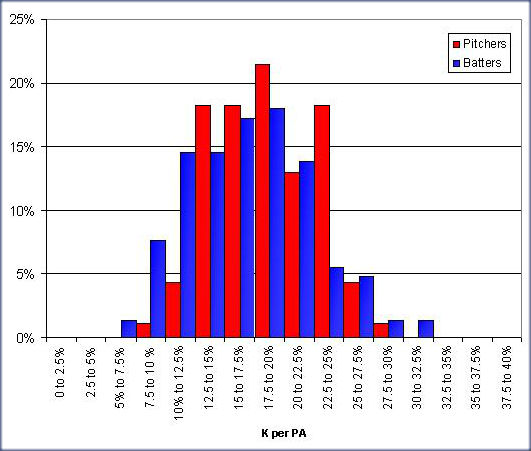
Click through for a histogram of the 2011 season broken down.

This plot shows the percentage of batters (among those qualified for the batting title) or pitchers (among those qualified for the ERA title) who had a given K per PA rate. At first glance, it may look like the distributions are quite similar. Notice, though, that the pitchers have a higher & narrower peak than the batters. Both groups have their peak in the 17.5 to 20% range but the pitchers have a significantly higher fraction of their members in this bin. The batters, meanwhile, place a higher percentage of players at the edges–below 12.5% and above 25%.
The data shows the same as what we described in words above–that batters have a wider range than pitchers. This means that striking out is really more in the batter’s control than the pitcher’s. Pretty much every starting pitcher will have a K rate within 50% of the average, while many batters do not.
